Many of the standard procedures for processing ‘omics data sets for gene expression, protein abundance, ribosomal similarity, etc can be applied to metabolomics data as well. However, metabolites are unique in that they are the products of metabolism; where the other techniques lay the foundation for metabolism to occur. Example analysis approaches by JGI-metabolomics user’s are described below. These examples are not meant to provide in depth teaching, but a starting point for how one might approach their own analysis.
Daniel Caddell
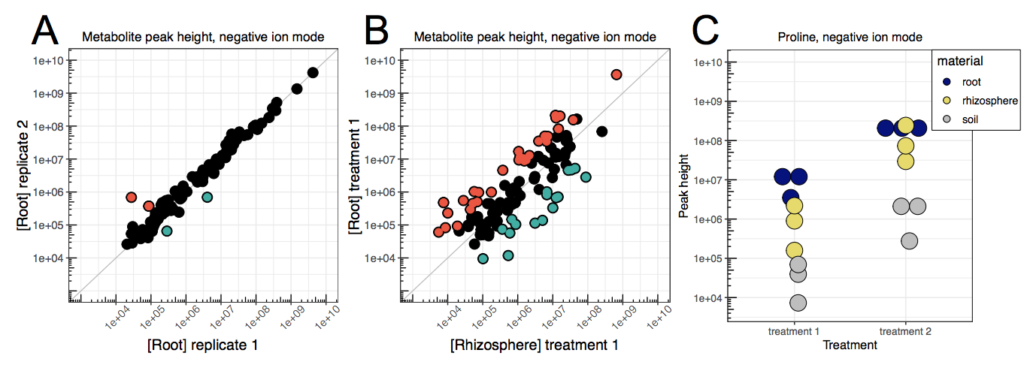
 Daniel Caddell is a Research Biologist at US Department of Agriculture (USDA) Agricultural Research Service (ARS). A useful first step in analyzing metabolomics data is to assess global trends in the data, beginning with assessing the robustness of sample replicates. For this, a scatterplot (log scale) can quickly be generated (in a spreadsheet program such as Microsoft Excel, or a programming language such as R) to compare trends in ion abundances between sample replicates. If the quality of the samples is high, very few significantly different ion abundances should be observed between replicates (Figure DC1A). In addition to determining the robustness of sample replicates, this method can be applied to probing relative peak heights of individual metabolites for outliers, whose ion abundances differ between sample type, location, or treatment, as seen in Figure DC1B-C. However, if the quantification of individual metabolites has not been performed, these relative ion abundances are not suitable for absolute metabolite level quantification (e.g. micrograms per gram of sample) or comparisons between different metabolites, due to differences in ionization efficiencies and the influence of the biological matrix.

Figure 1. Comparison of ion abundances between (A) replicates and (B) sample types. Each dot represents an individual metabolite present in the dataset, with red or blue filled dots indicating the metabolites that were more abundant in one dataset or the other (fold change > 2). (C) Single metabolites can also be analyzed before or after normalization.
Notably, normalization of the data to account for background signals present in extraction blanks can be accomplished by two different methods. First, the background signal present in extraction blanks can simply be subtracted from the corresponding ion abundance in the experimental samples. Alternatively, a value representing the lower detection limit in the dataset (e.g. ~4,000 in Figure DC1) can replace any empty data points, either in extraction blanks or experimental samples, prior to normalization. The rationale for this substitution is that metabolites absent from a sample cannot be distinguished from metabolites present below the detection threshold. After normalization, metabolite peak height can be converted to percent relative abundance by setting the maximum peak height observed across all samples to 100%. While searching for the metabolites whose ion abundances have large fold changes is a useful heuristic for analysing metabolomic data, it can be beneficial to further subset metabolites by a combination of heuristic thresholds including significance (ie: P<0.05), fold change (ie: 2 or more), and minimum intensity (ie: 10x the background).
Ryan Lenz
 Pathway analysis with MetaboAnalyst (Ryan Lenz). MetaboAnalyst is a useful online interface that allows a researcher to conduct many different types of analysis (Xia et al. 2015). This program is written in the R coding language allowing advanced users to change statistical and imaging parameters if desired. Generally, the online interface is sufficient for most analysis. To start, it is best to normalize the data before doing comparative statistics such as t-tests and fold change. MetaboAnalyst also has many choices for unsupervised and supervised modeling of metabolomic data and significant feature selection.

Figure 2. Overall data differentiation between mock-inoculated and inoculated stem tissue. (A) Principal component analysis (PCA) and (B) and Heatmap visualization of all (~250) metabolic features.
Figure 2 shows a principal component analysis and a heatmap to summarize the data. From here you can organize the fold-change table of all the metabolites and run it through enrichment and pathway analysis. This allows you to get a feel for the metabolomic reactions most represented by the data. Once your data is uploaded, you can choose a pathway library from an assortment of model species including mammals, plants, and microbes. Figure 3 is an example of how MetaboAnalyst can organize the most impacted metabolic pathways from your data.

Figure 3. Metabolic pathways altered by inoculated stems organized by pathway enrichment
analysis (p-values) and pathway topology analysis (pathway impact).
MAGI (https://magi.nersc.gov) is another tool that can add a layer of biological relevance to metabolomic data. Generally, MAGI allow users to screen an organism’s genome for biochemical pathways involving a list of metabolites identified from metabolomics studies. In this way, users can confirm that significant features are produced/sourced from their treatments. It can also help decipher the origin of identified metabolites in treatments involving more than one organism. For example, a significant metabolite from an experiment involving both a plant and a fungal pathogen was originally listed as putatively identified via LC-MS. This metabolite was screened with MAGI for both the plant and the fungus. The metabolite received a very low MAGI score for both organisms which indicates that it most likely is not produced in that context and is likely mis-identified. As a result, a user can reevaluate the m/z and retention times and select a biologically relevant metabolite for further analysis.
Candice Swift

Candice Swift is a graduate student in the O’Malley lab at UC Santa Barbara.
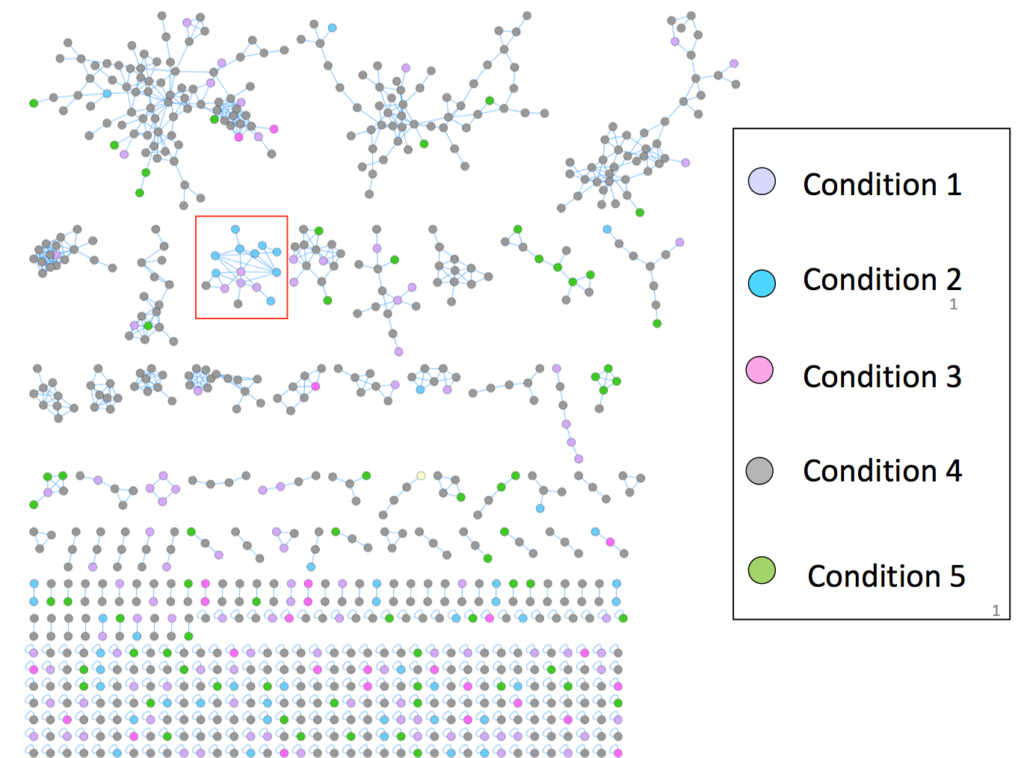
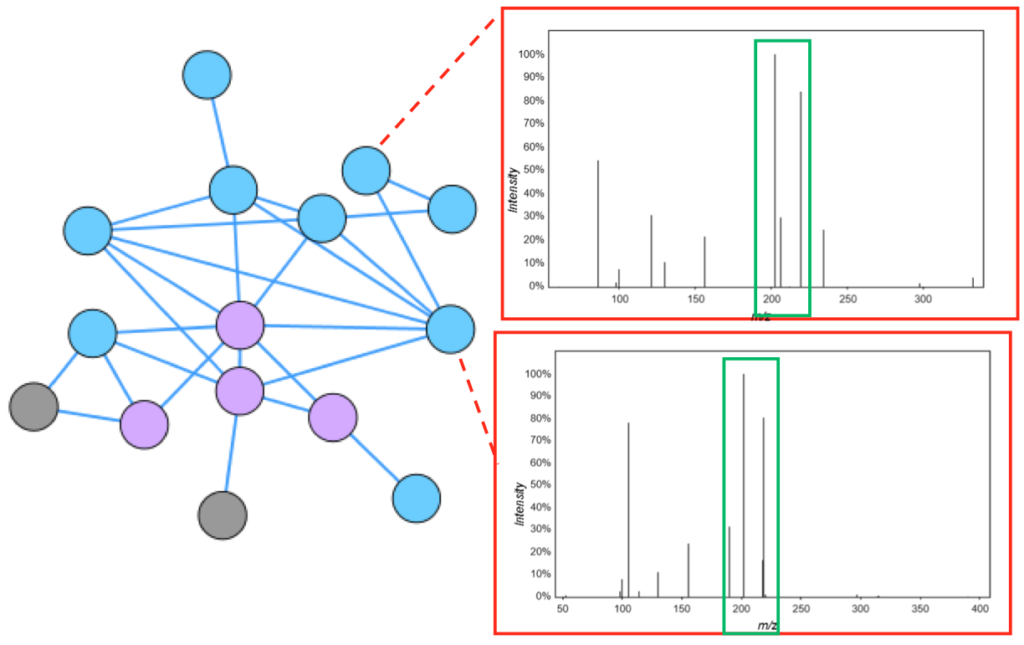
Molecular Networking (Candice Swift). Global Natural Products Social Molecular Networking (Ming et al. Nature Biotechnology 2016) GNPS) [Ming et al. Nature Biotechnology 2016] is a powerful technique for visualizing metabolomics datasets. In a molecular network, each node represents an MS/MS spectra for a particular m/z, retention time pair. Spectra are compared and given a cosine score between zero and one: a score of zero represents spectra without any similarity and a score of one represents a complete match. Similar nodes are connected by edges (the default threshold is 0.7), resulting in a network of clustered spectra. Mass differences between nodes can be used to gain structural insights into functional groups that may be present in the parent ions (for an example, see Fig. 2B of Watrous et al.PNAS 2012).
 The GNPS data analysis pipeline used to create molecular networks has several useful features: 1) users can match unknown spectra to the GNPS compilation of spectral libraries, 2) it includes a built-in network visualization browser that allows visualization of clusters and comparison of experimental spectra to the spectra of known compounds in the libraries, and 3) comparison of up to six different experimental conditions. This list is far from comprehensive, with more improvements and features constantly being added. Users are encouraged to explore GNPS for themselves. For more stringent library matching, be sure to adjust the mass difference tolerance, called Maximum Analog Search Mass Difference (default is 100 ppm).

Getting started is fairly straightforward, with video tutorials, in-depth documentation, and even regular office hours (see the main website here). Parameters to consider adjusting when creating a network include the following (default given in parenthesis): Min Pairs Cos (0.7), Maximum Connected Component Size (100), Minimum Cluster Size (2), and Maximum Analog Search Mass Difference (100.0)
When using GNPS, please cite Wang, Mingxun, et al. “Sharing and community curation of mass spectrometry data with Global Natural Products Social Molecular Networking.” Nature Biotechnology 34.8 (2016): 828-837. PMID: 27504778
Marc Chevrette
 Phylogeny and Metabolic similarity (Marc Chevrette). Metabolism is a complex trait shaped by ecological and evolutionary forces. As such, organismal metabolism can be explored in a phylogenetic framework to help explain underlying environmental (e.g. nutrient acquisition, flux) and species-species (e.g. host-microbe metabolic exchange, secondary metabolism) interactions. Gene-metabolite relationships (see MAGI section above) in the context of phylogenies offer insight into the evolutionary histories of pathways and allow for comparisons across gene topologies, population structure, and ecology.
Chevrette MG, Carlos-Shanley C, Louie KB, Bowen BP, Northen TR and Currie CR (2019) Taxonomic and Metabolic Incongruence in the Ancient Genus Streptomyces. Front. Microbiol. 10:2170. doi: 10.3389/fmicb.2019.02170