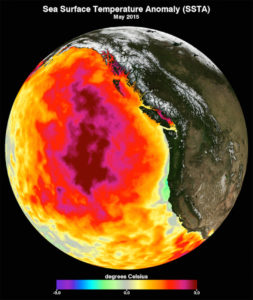
This data image shows the monthly average sea surface temperature for May 2015. Between 2013 and 2016, a large mass of unusually warm ocean water–nicknamed the blob–dominated the North Pacific, indicated here by red, pink, and yellow colors signifying temperatures as much as three degrees Celsius (five degrees Fahrenheit) higher than average. Data are from the NASA Multi-scale Ultra-high Resolution Sea Surface Temperature (MUR SST) Analysis product. (Courtesy NASA Physical Oceanography Distributed Active Archive Center)
