Image shot from below of a gray building with clouds passing above


Text with a description of the DOE JGI's vision and mission next to an image of purple-gloved hands working with a glass container holding plant cuttings and a pipette. Transcribed Text: Vision The vision of the U.S. Department of Energy (DOE) Joint Genome Institute (JGI), a DOE Office of Science user facility at Lawrence Berkeley National Laboratory (Berkeley Lab), is to become the leading integrative genome science user facility enabling researchers to solve the world’s evolving energy and environmental challenges. Mission The mission of the JGI is to provide the global research community with access to the most advanced integrative genome science capabilities in support of the DOE’s research mission.


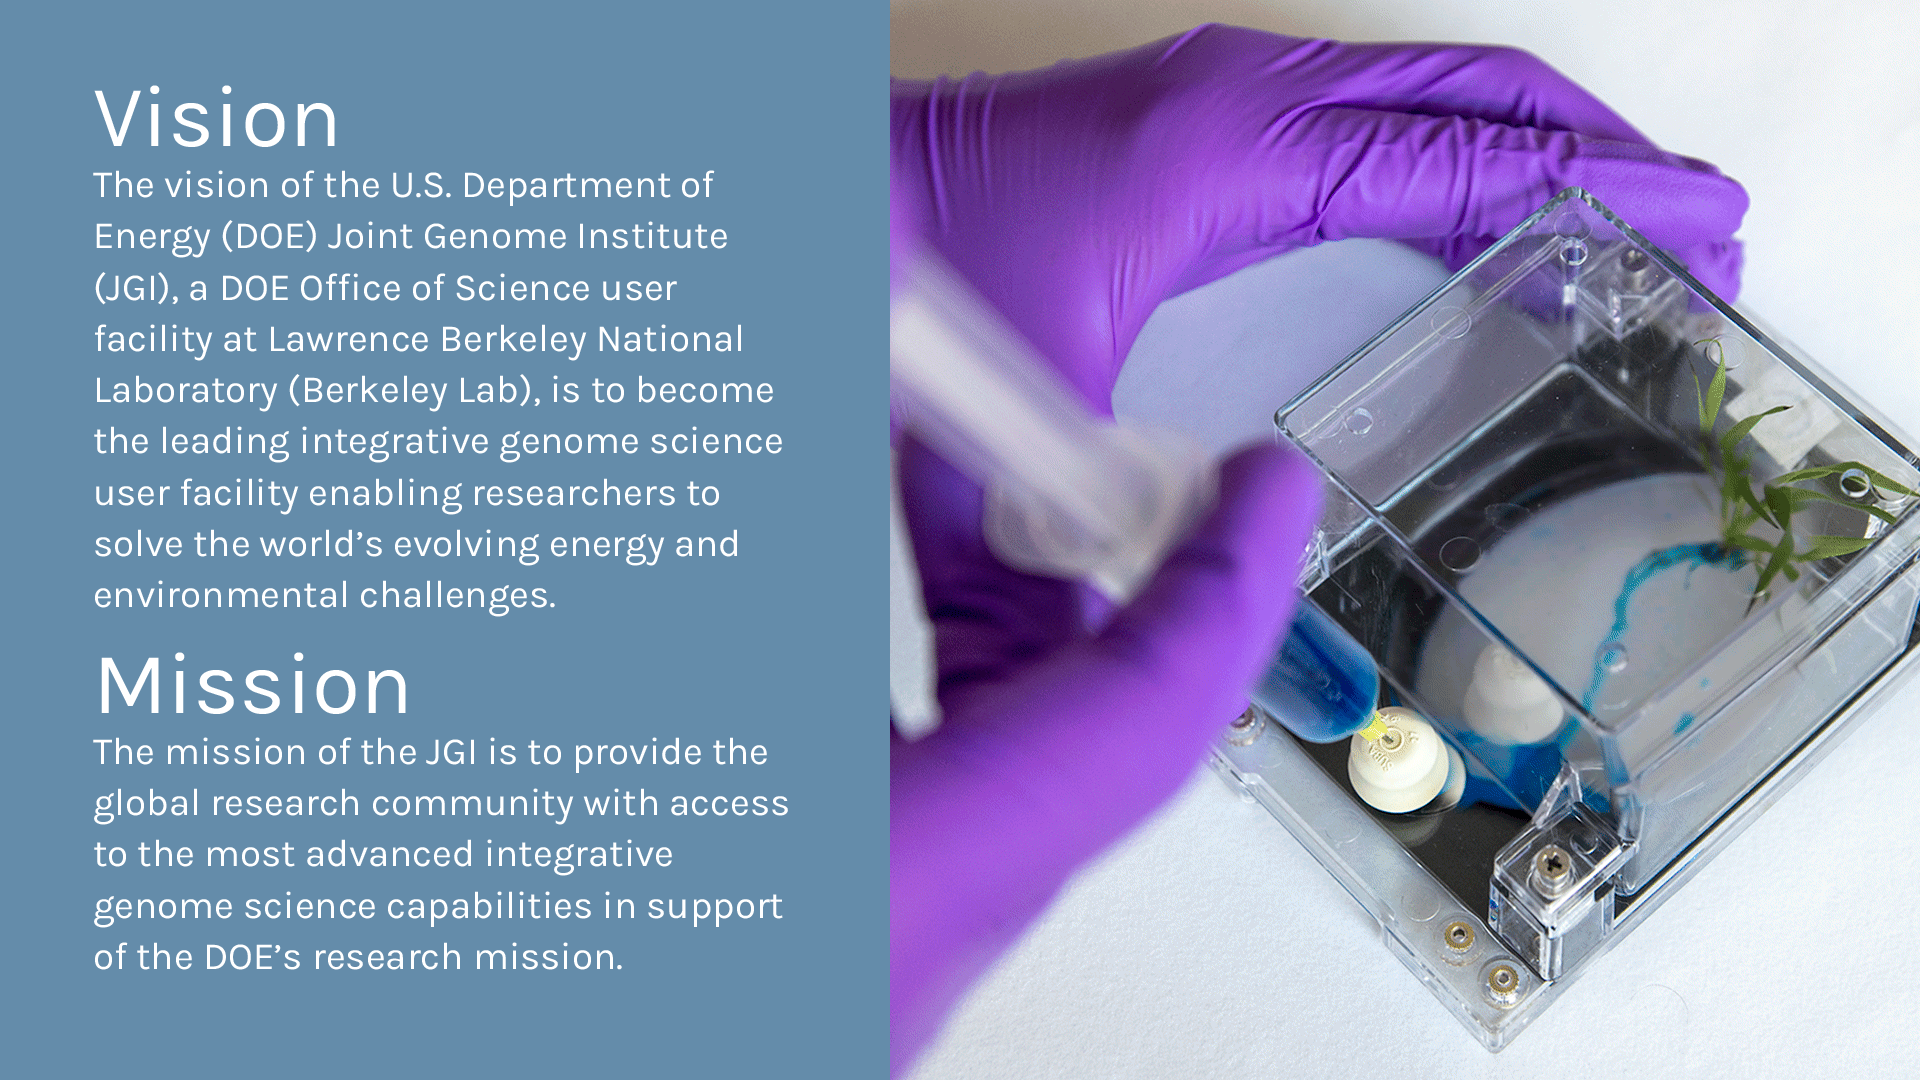
Director's Perspective


In 2021, several researchers and staff supporting the JGI user community were recognized by multiple organizations.
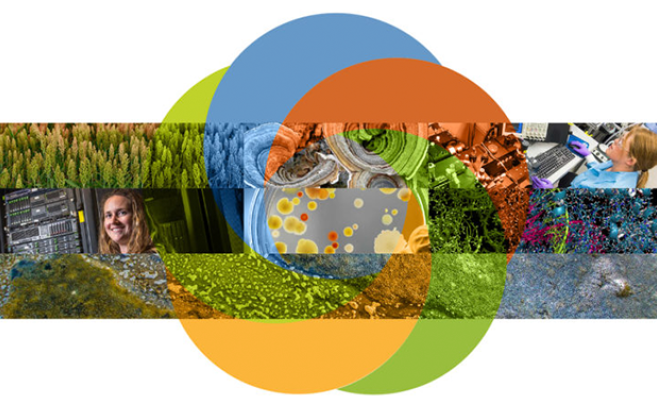
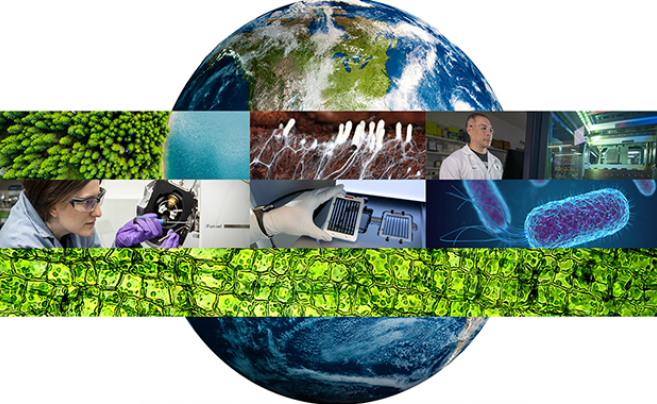
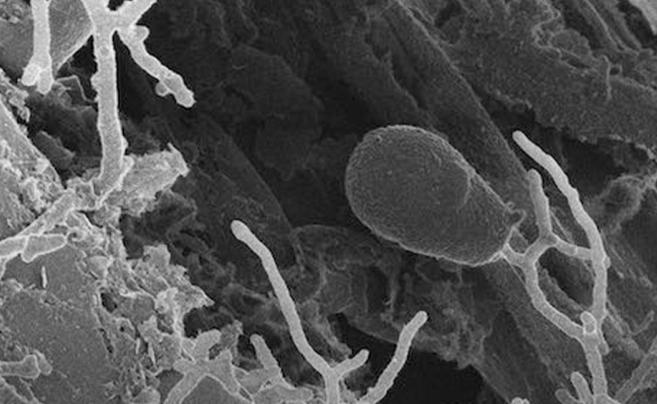
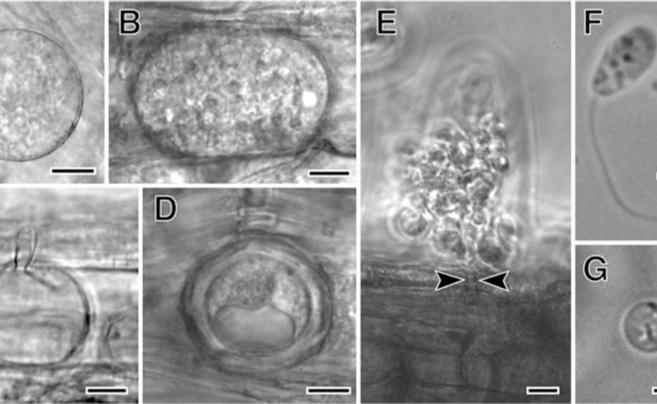
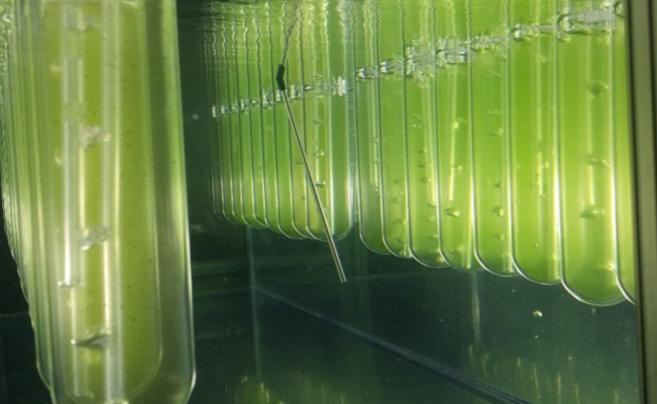
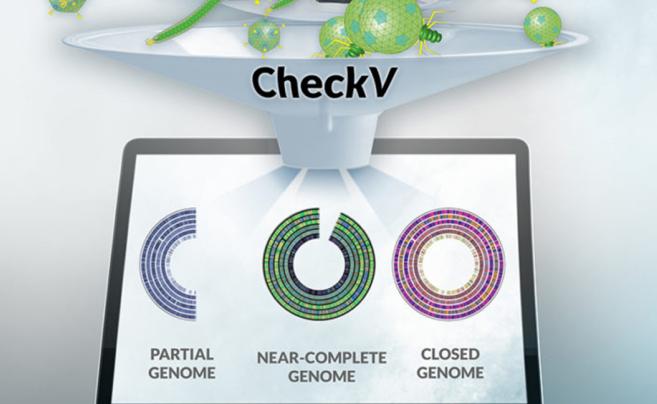
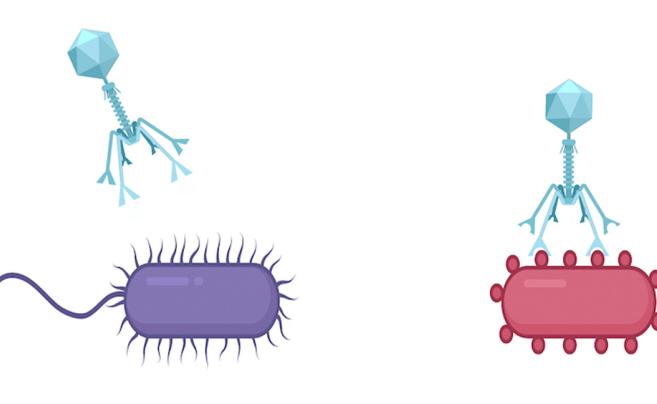
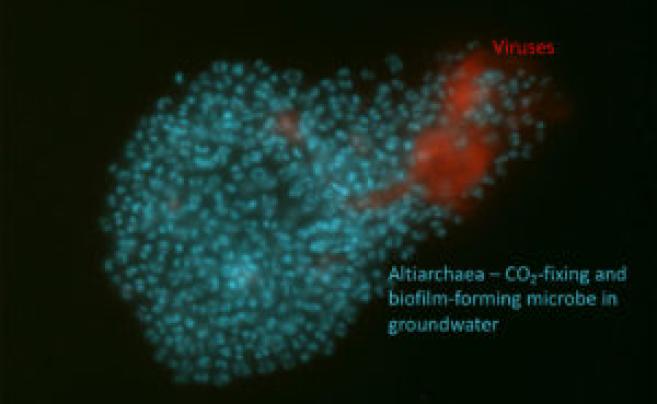
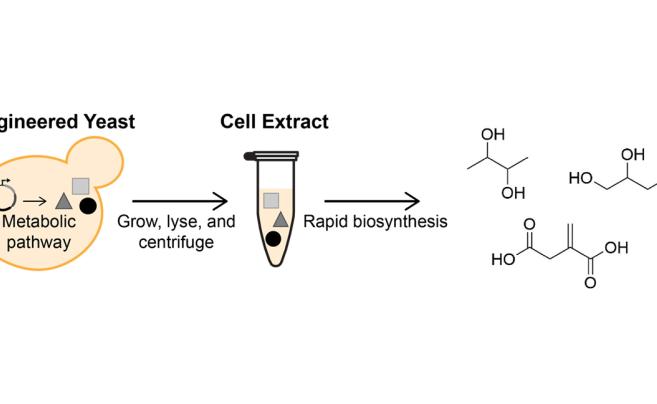


Science Highlights

A person in a lab coat and mask works with green plants in a brightly lit laboratory.


Science Feature
Shattering Expectations: Novel Seed Dispersal Gene Found in Green Millet
Read More
DOE Science Highlights
The Case for Conservation
Read More
DOE Science Highlights
Gut Fungi: Unexpected Source of Novel Chemicals
Read More
DOE Science Highlights
Bacteria and Fungi Divvy Up the Work in Forest Floor
Read More
Science Feature
Olpidium, The Key to the Origin of Terrestrial Fungi
Read More
DOE Science Highlights
Marine Microbe Contains Multitudes
Read More
DOE Science Highlights
A One-Stop Shop for Analyzing Algal Genomes
Read More
Science Feature
Climate Change Threatens Base of Polar Oceans’ Bountiful Food Webs
Read More
DOE Science Highlights
Refining the Process of Identifying Algae Biotechnology Candidates
Read More
Science Feature
Green Algae Reveal One mRNA Encodes Many Proteins
Read More
DOE Science Highlights
An Automated Tool for Assessing Virus Data Quality
Read More
DOE Science Highlights
A Natural Mechanism Can Turbocharge Viral Evolution
Read More
DOE Science Highlights
Plotting a Model for Virus-Host Warfare Deep Below Ground
Read More
Science Feature
An Age of CRAGE: Advances in Rapidly Engineering Non-model Bacteria
Read More
Science Feature
Designer DNA: JGI Helps Users Blaze New Biosynthetic Pathways
Read More
Science Feature
Boosting Small Molecule Production in Super “Soup”
Read More

Impact: By the Numbers
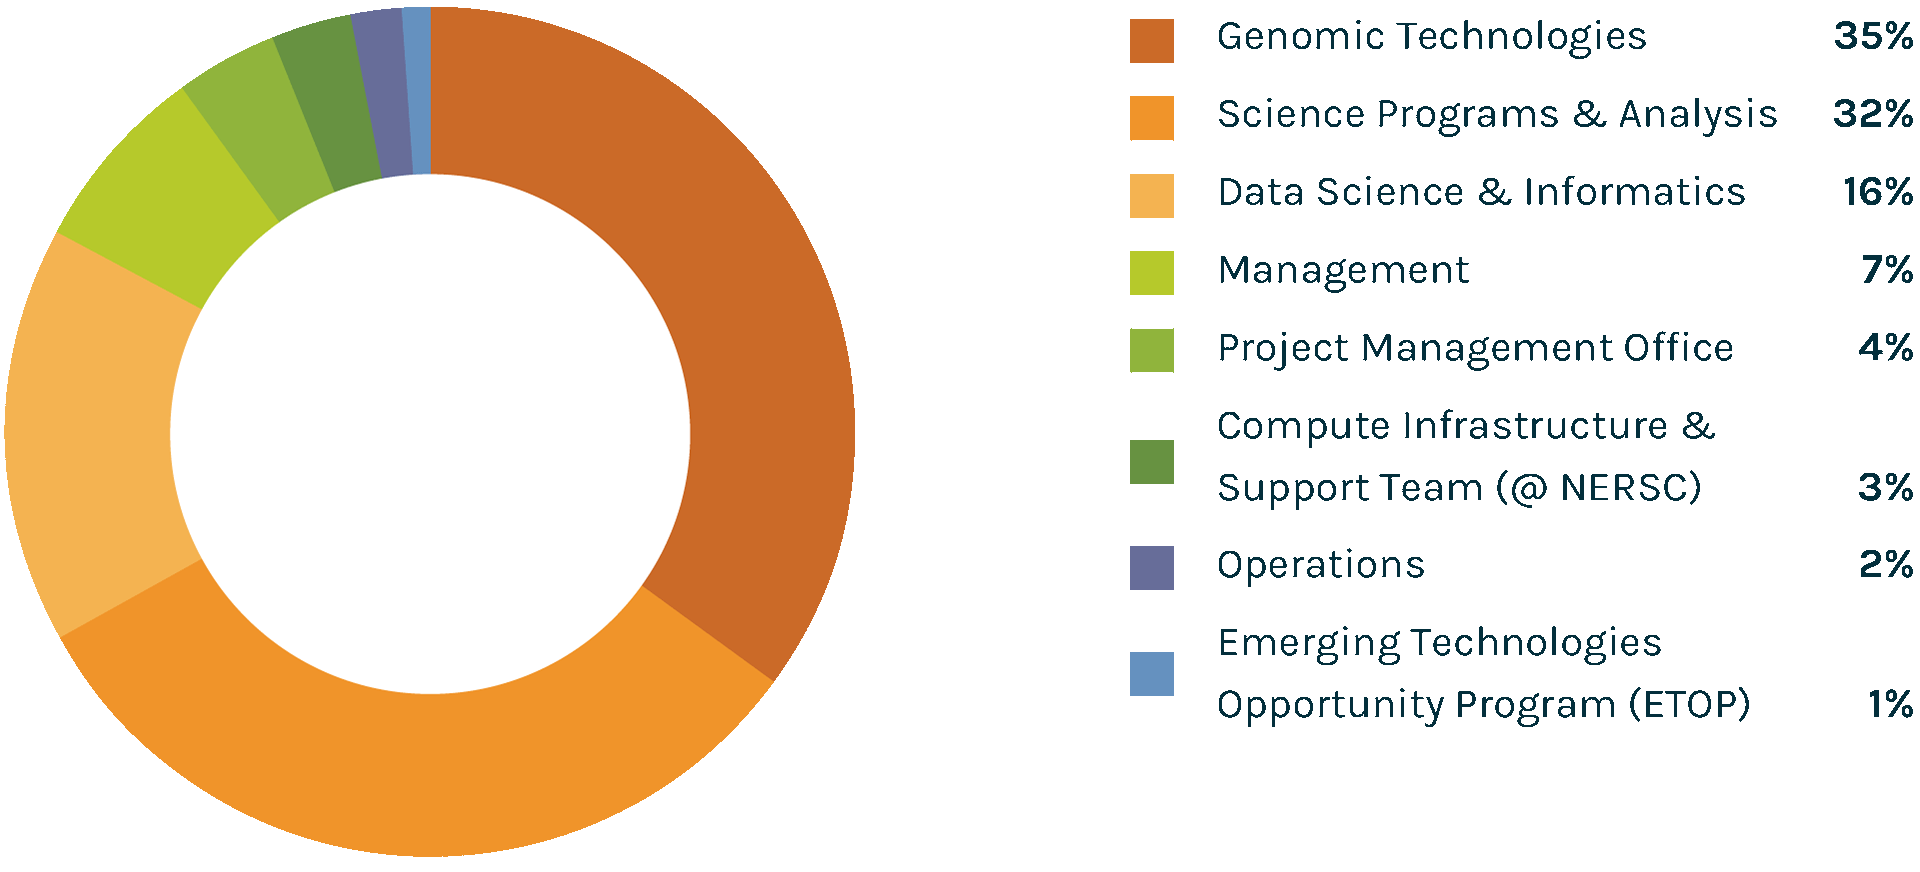
Scientist in a lab coat working with a computer beside a large automated lab machine.
 
Spending Profile
Donut chart showing percentages of different categories with a color-coded legend. Transcribed Text: Genomic Technologies 35% Science Programs & Analysis 32% Data Science & Informatics 16% Management 7% Project Management Office 4% Compute Infrastructure & Support Team (@ NERSC) 3% Operations 2% Emerging Technologies Opportunity Program (ETOP) 1%


Users on the Global Map 
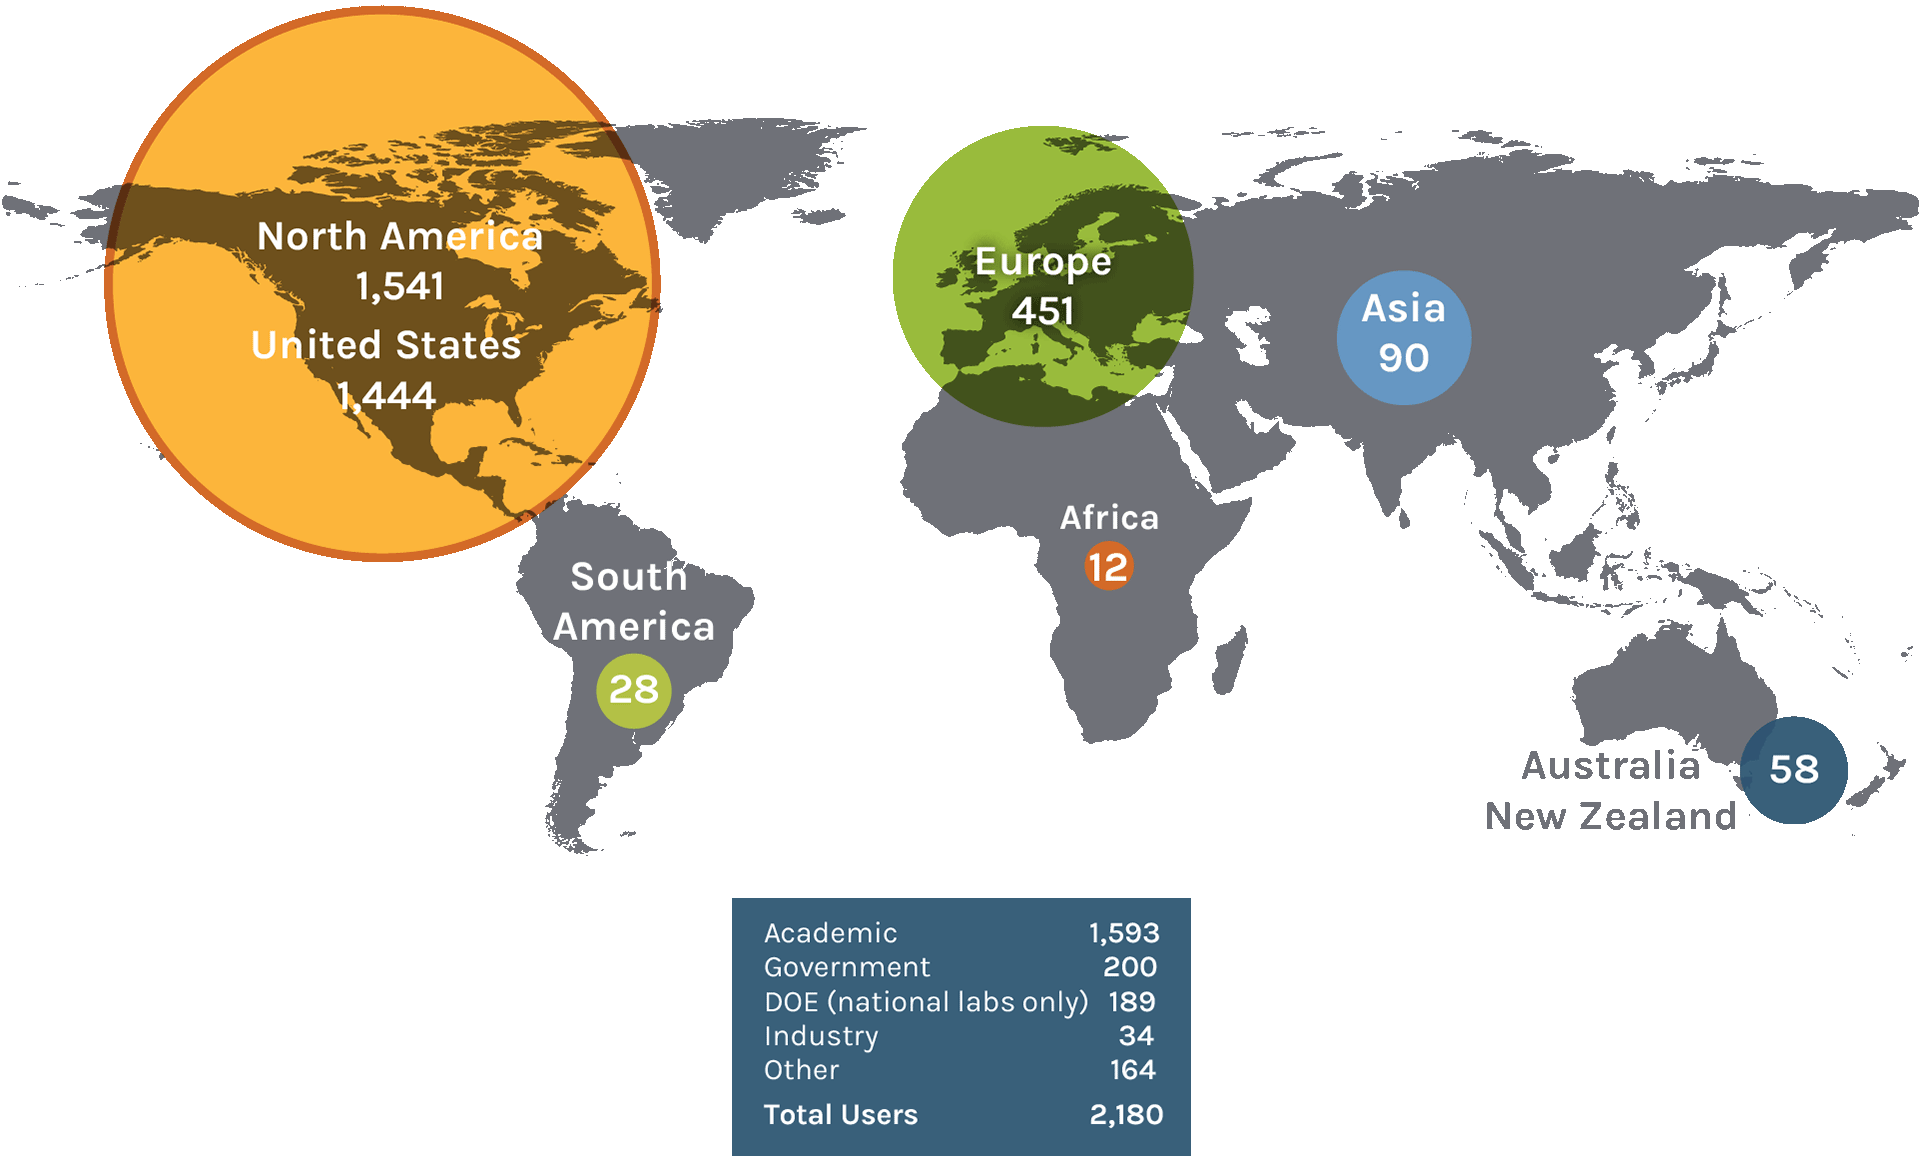
World map showing user distribution with circles: North America 1,541, Europe 451, Asia 90, Australia-New Zealand 58, South America 28, Africa 12. Transcribed Text: North America 1,541 United States 1,444 Europe 451 Asia 90 South America 28 Africa 12 Australia New Zealand 58 Academic 1,593 Government 200 DOE (national labs only) 189 Industry 34 Other 164 Total Users 2,180


RegionCountRegionCountRegionCount
North America1,541Europe451Asia90
United States1,444Denmark11Japan19
Canada92Estonia2China36
Mexico5Finland13India13
  France55Israel9
  Germany95Malaysia1
South America28Greece3Singapore3
Argentina1Hungary11South Korea5
Brazil20Iceland1Taiwan2
Chile1Ireland3Vietnam1
Colombia2Italy31  
Uruguay4Netherlands26Australia & New Zealand58
  Norway22Australia47
  Poland3New Zealand11
  Portugal8  
  Russia5  
  Serbia2Africa12
  Slovenia2Morocco2
  Spain40Nigeria1
  Sweden19  
  Switzerland11  
  Turkey1  
  United Kingdom56  
 
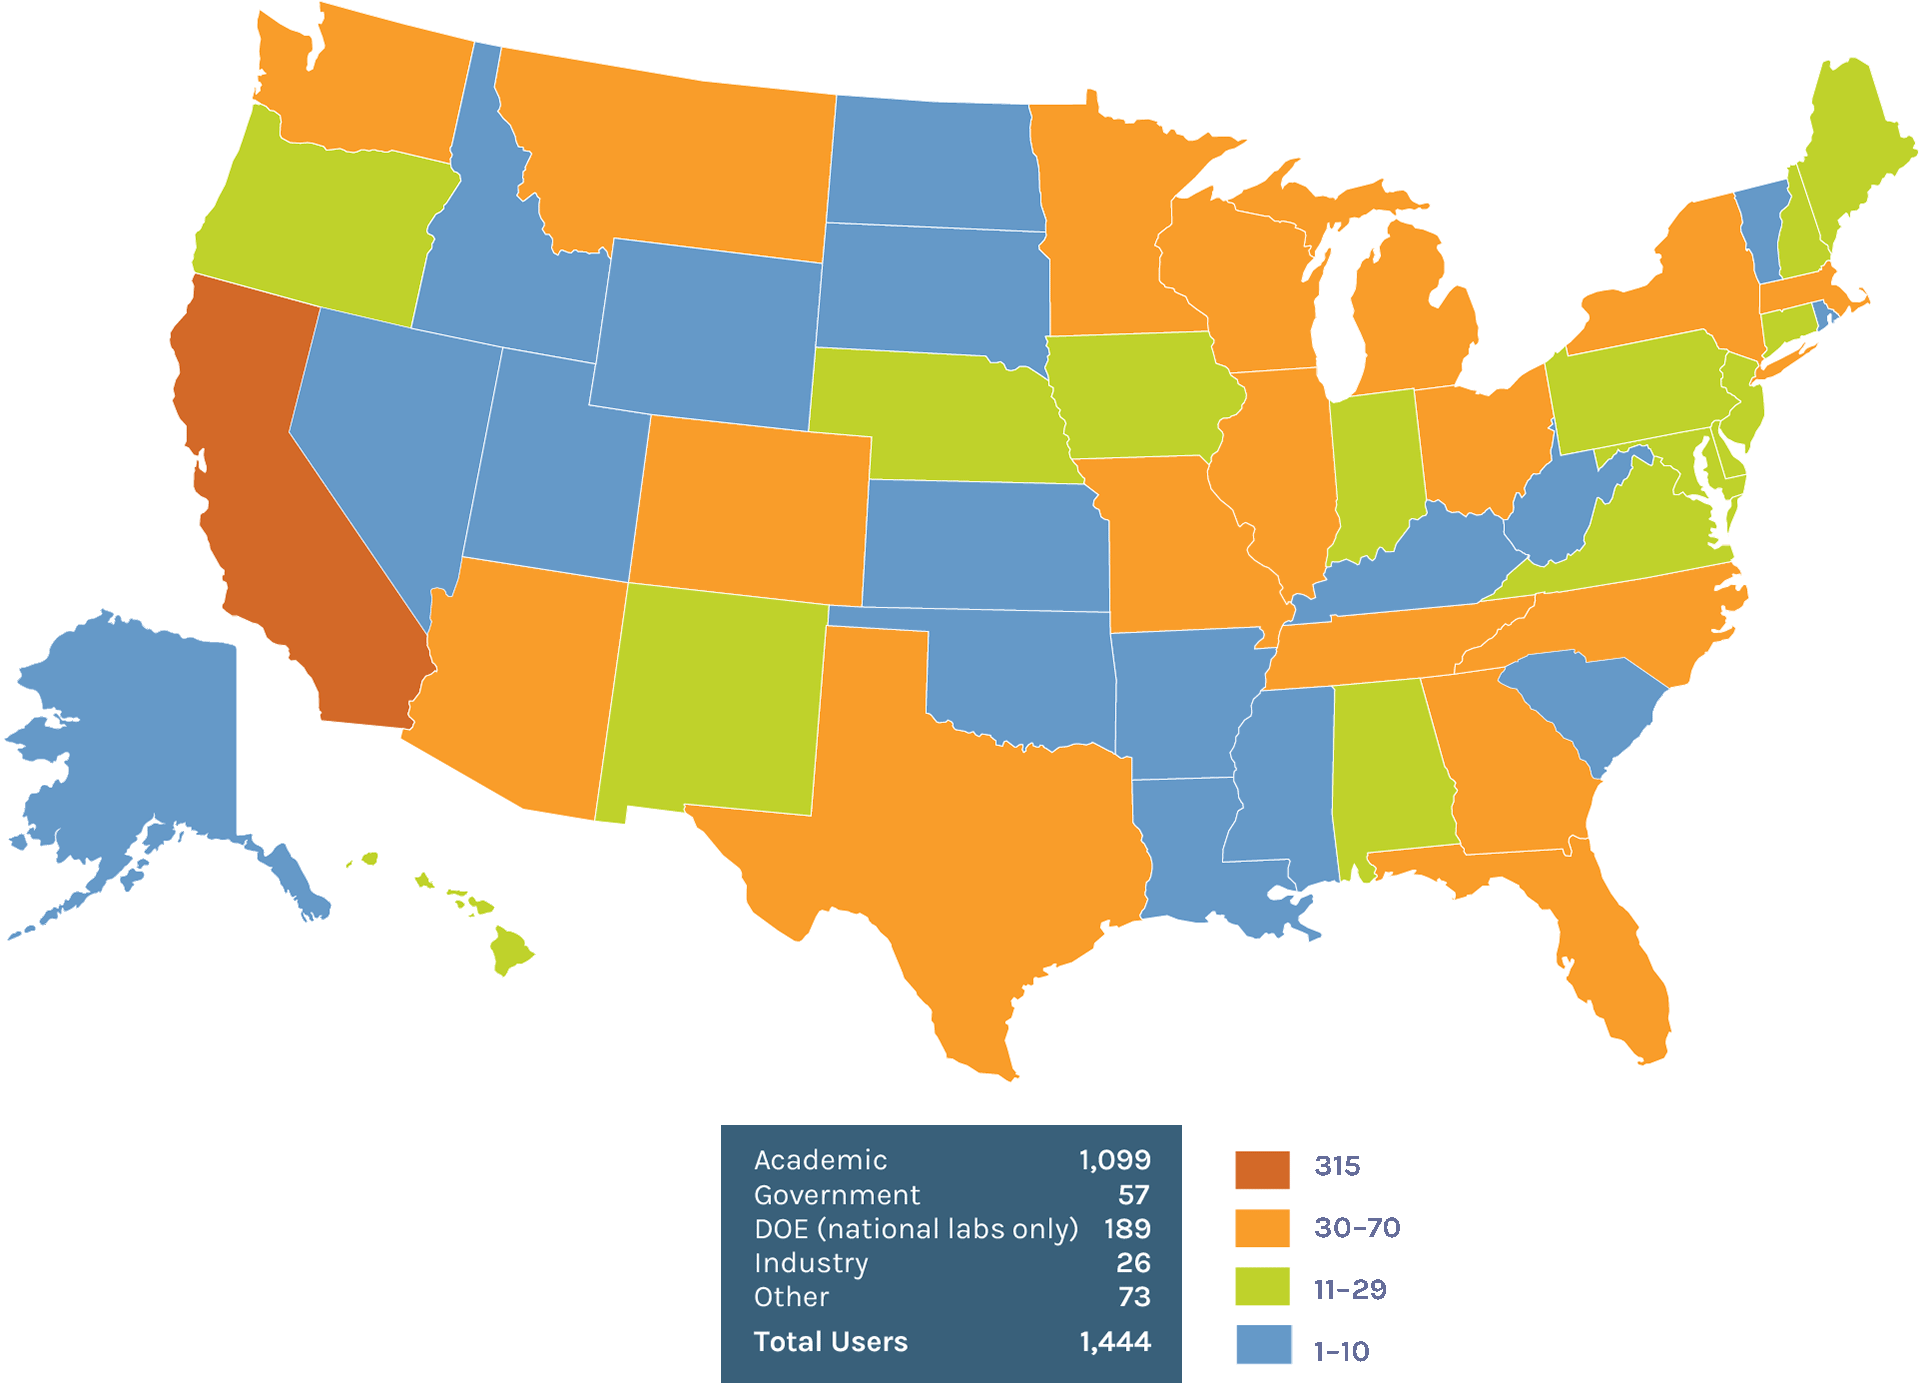
Users on the U.S. Map
Color-coded U.S. map showing user distribution by state with a legend indicating total user ranges. Transcribed Text: Academic 1,099 Government 57 DOE (national labs only) 189 Industry 26 Other 73 Total Users 1,444


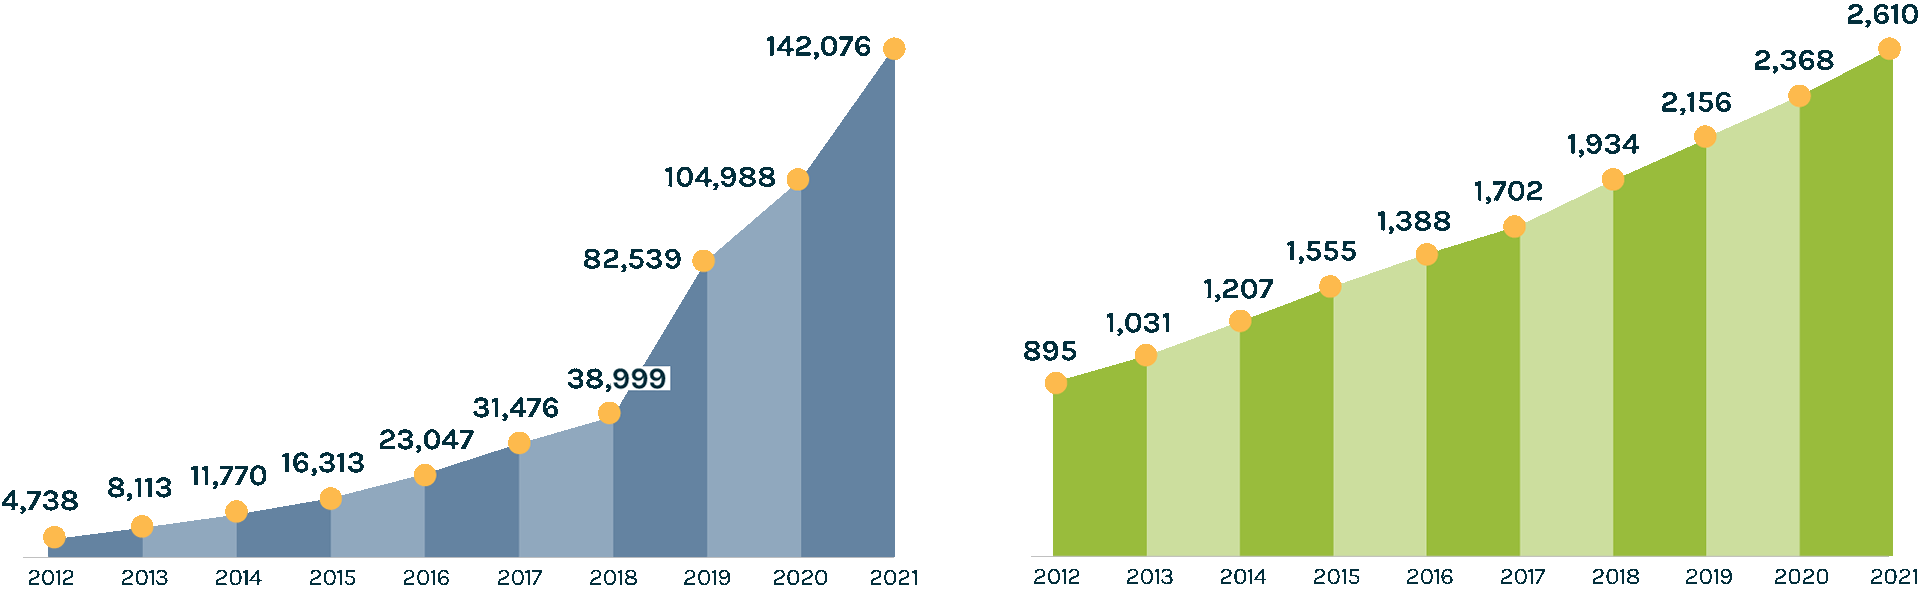
Cumulative Number of Projects Completed

Cumulative Number of Scientific Publications
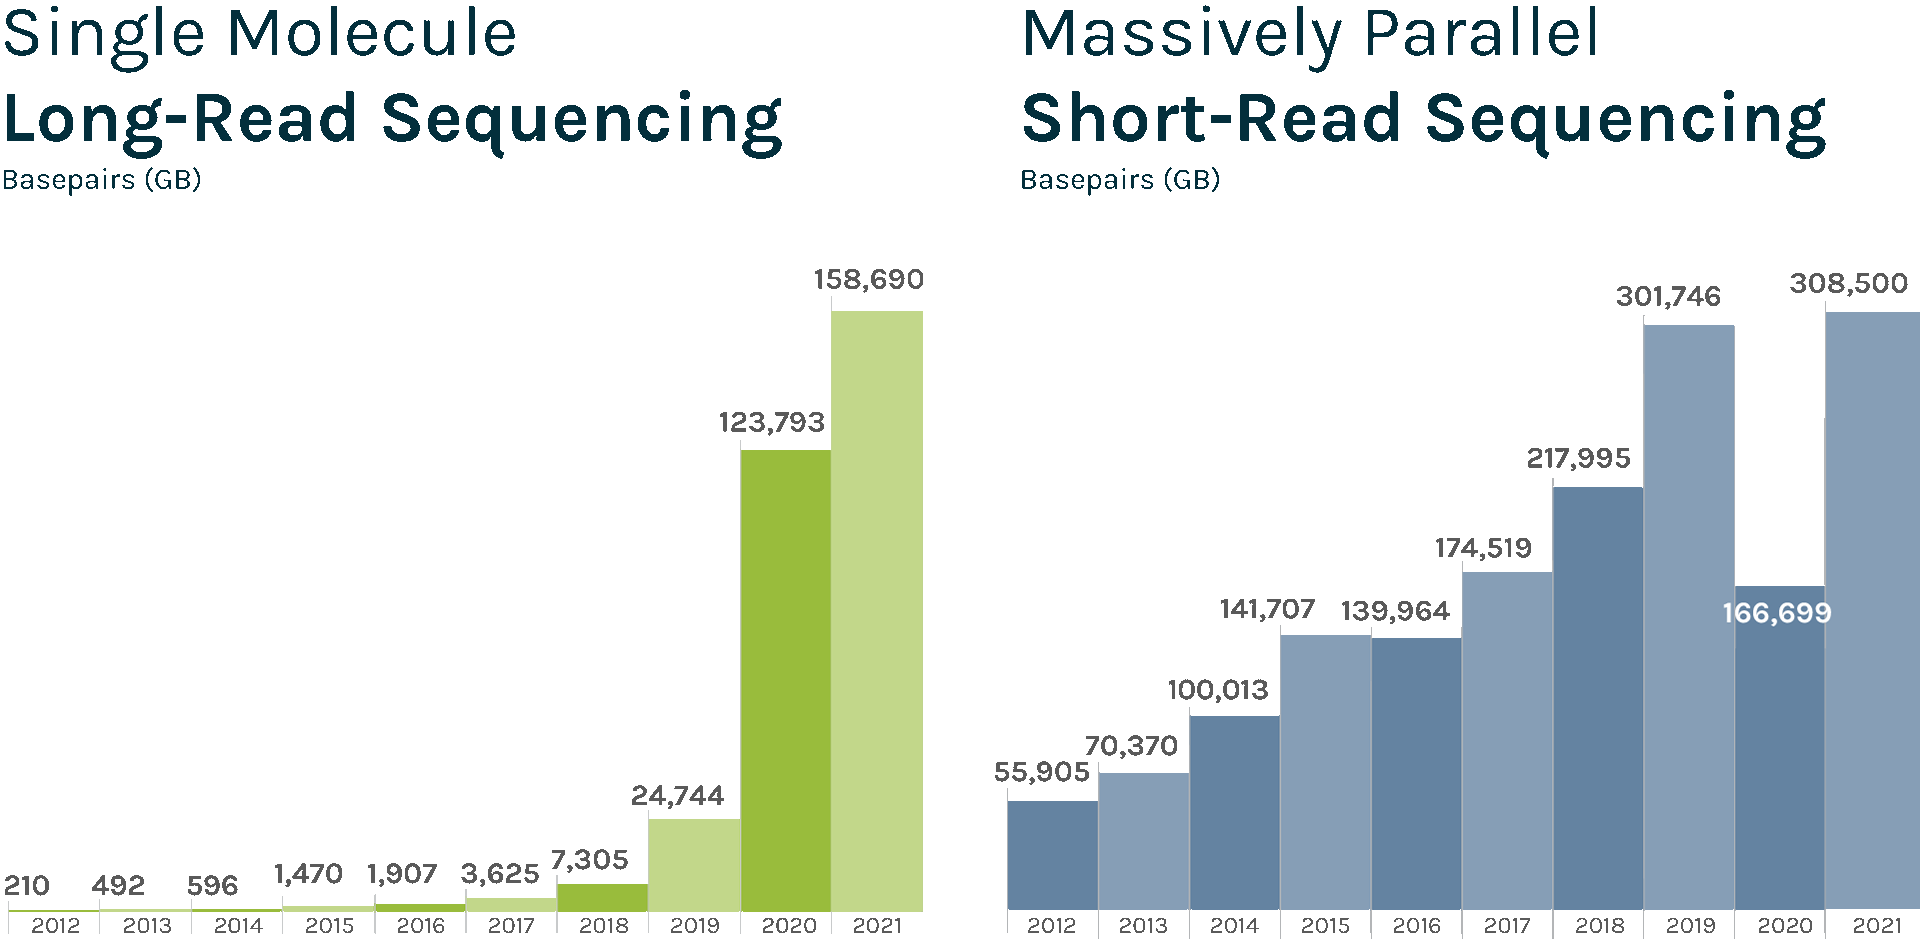
Two bar charts from 2012 to 2021 showing growth in blue and green bars with labeled data points. Transcribed Text: Left Chart: 2012 - 4,738 2013 - 8,113 2014 - 11,770 2015 - 16,313 2016 - 23,047 2017 - 31,476 2018 - 38,999 2019 - 82,539 2020 - 104,988 2021 - 142,076 Right Chart: 2012 - 895 2013 - 1,031 2014 - 1,207 2015 - 1,555 2016 - 1,388 2017 - 1,702 2018 - 1,934 2019 - 2,156 2020 - 2,368 2021 - 2,610


 Sequencing Output 

(in billions of base pairs)

The JGI supports short- and long-read sequencers, where a read refers to a sequence of DNA bases. Short-read sequencers produce billions of pared-end 150 basepair reads used for quantification, such as in gene expression analysis. Long-read sequencers currently average 60,000–70,000 bp reads and are used for de novo genome assembly. Combined short-read and long-read totals per year give the JGI's annual sequence output. The total sequence output in 2021 was 467,195 GB. 

Bar graphs comparing Single Molecule Long-Read Sequencing and Massively Parallel Short-Read Sequencing basepairs from 2012 to 2021. Transcribed Text: Single Molecule Long-Read Sequencing Basepairs (GB) Massively Parallel Short-Read Sequencing Basepairs (GB) 2012: 210, 55,905 2013: 492, 70,370 2014: 596, 100,013 2015: 1,470, 141,707 2016: 1,907, 139,964 2017: 3,625, 174,519 2018: 7,305, 217,995 2019: 24,744, 301,746 2020: 123,793, 166,699 2021: 158,690, 308,500


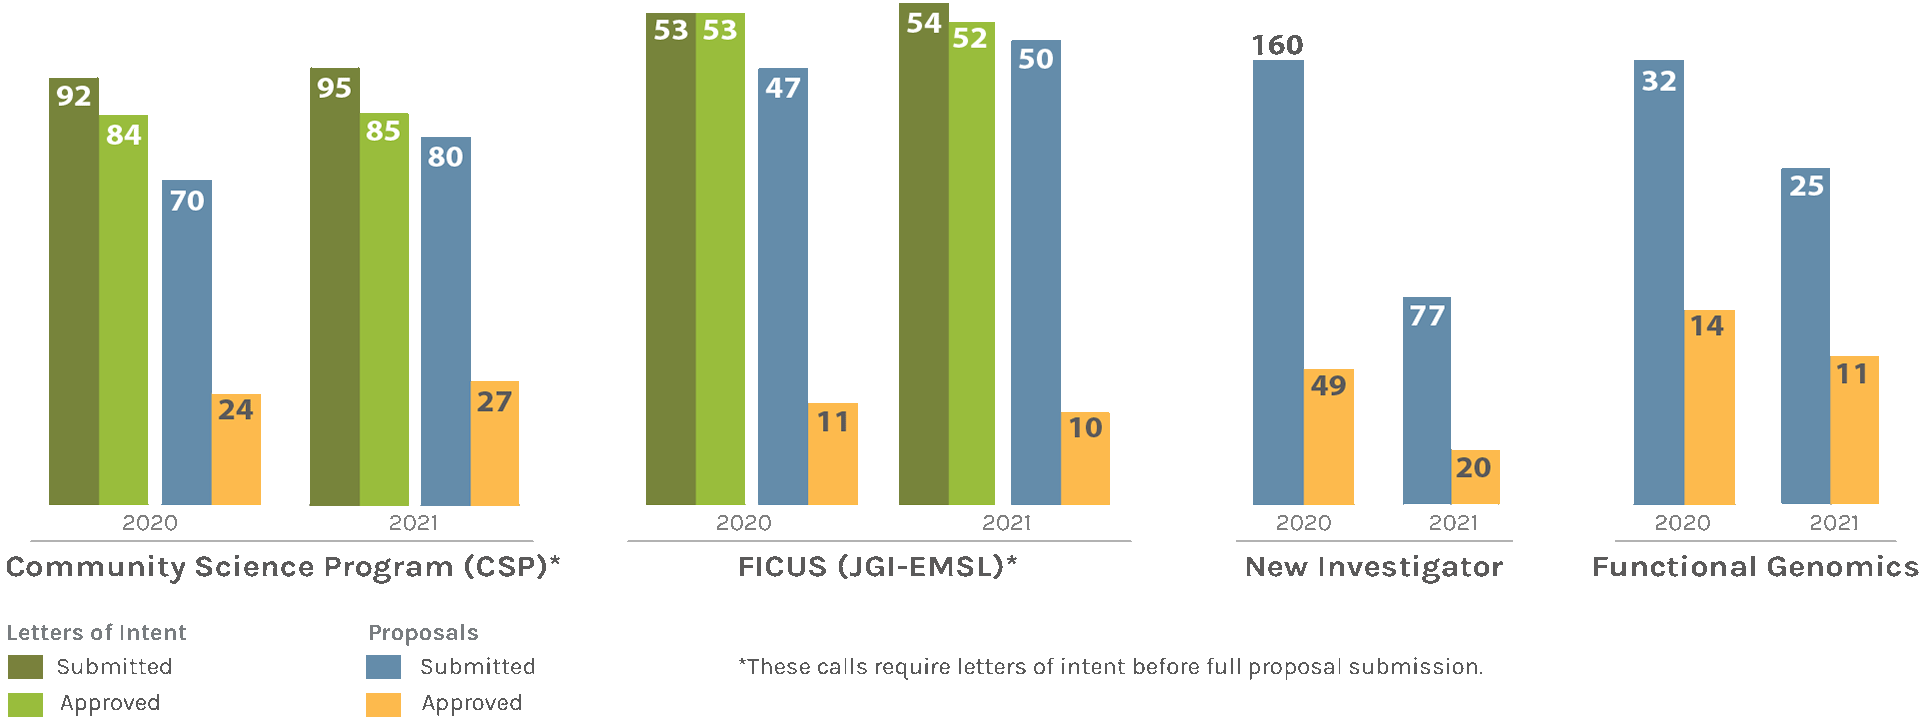
Users Letters of Intent/Proposals Submitted & Approved

Bar chart comparing submitted and approved proposals for CSP, FICUS, New Investigator, and Functional Genomics in 2020 and 2021. Transcribed Text: Community Science Program (CSP)* FICUS (JGI-EMSL)* New Investigator Functional Genomics Letters of Intent Submitted Approved Proposals Submitted Approved *These calls require letters of intent before full proposal submission.


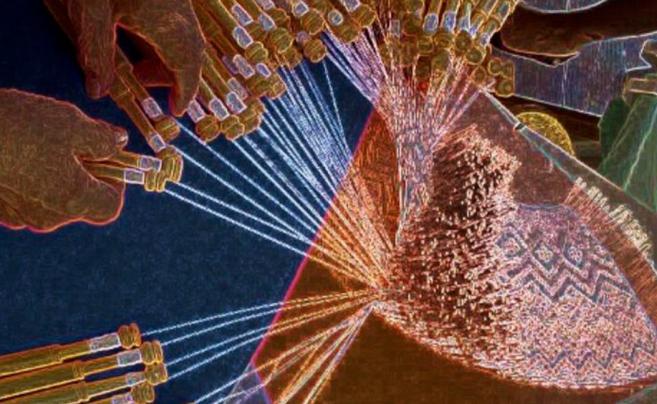
Computational Infrastructure

A man kneeling in front of a server rack in a data center, observing green and blue indicator lights on the equipment.

 The JGI has generated petabytes of high-quality sequence data and analysis; rapid and smooth access to the public datasets by the research community is enabled by high-performance computing resources and infrastructure.  In this image, NERSC engineer James Botts studies a computer system cluster.

Users of JGI Tools & Data

The Genome Portal provides unified access to all JGI genomic databases and analytical tools. A user can search, download and explore multiple data sets available for all JGI sequencing projects including their status, assemblies, and annotations of sequenced genomes. Launched in FY2021, the Data Portal allows JGI users to more easily access public data sets through a common set of metadata across the files that are submitted by each scientific program. The Genome Portal will be retired once the same features are available on Data Portal.

  • JGI Archive and Metadata Organizer (JAMO): 1,010 million file records
  • JAMO Archived Data Footprint: 11.683 Petabytes (PB)
  • Data Downloads in FY21: 4.201 million files; 1.646 PB


Photography and cinemagraphs by Thor Swift, Berkeley Lab. Design by Creative Services, IT Division, Berkeley Lab.

Back to Science Stories
More Details