

As in every year, our successes and achievements are solely attributable to our incredible staff, our partners, our user community, DOE and other stakeholders for their support. I look forward to the continued evolution of the JGI and the amazing science over the next year.
Sincerely,

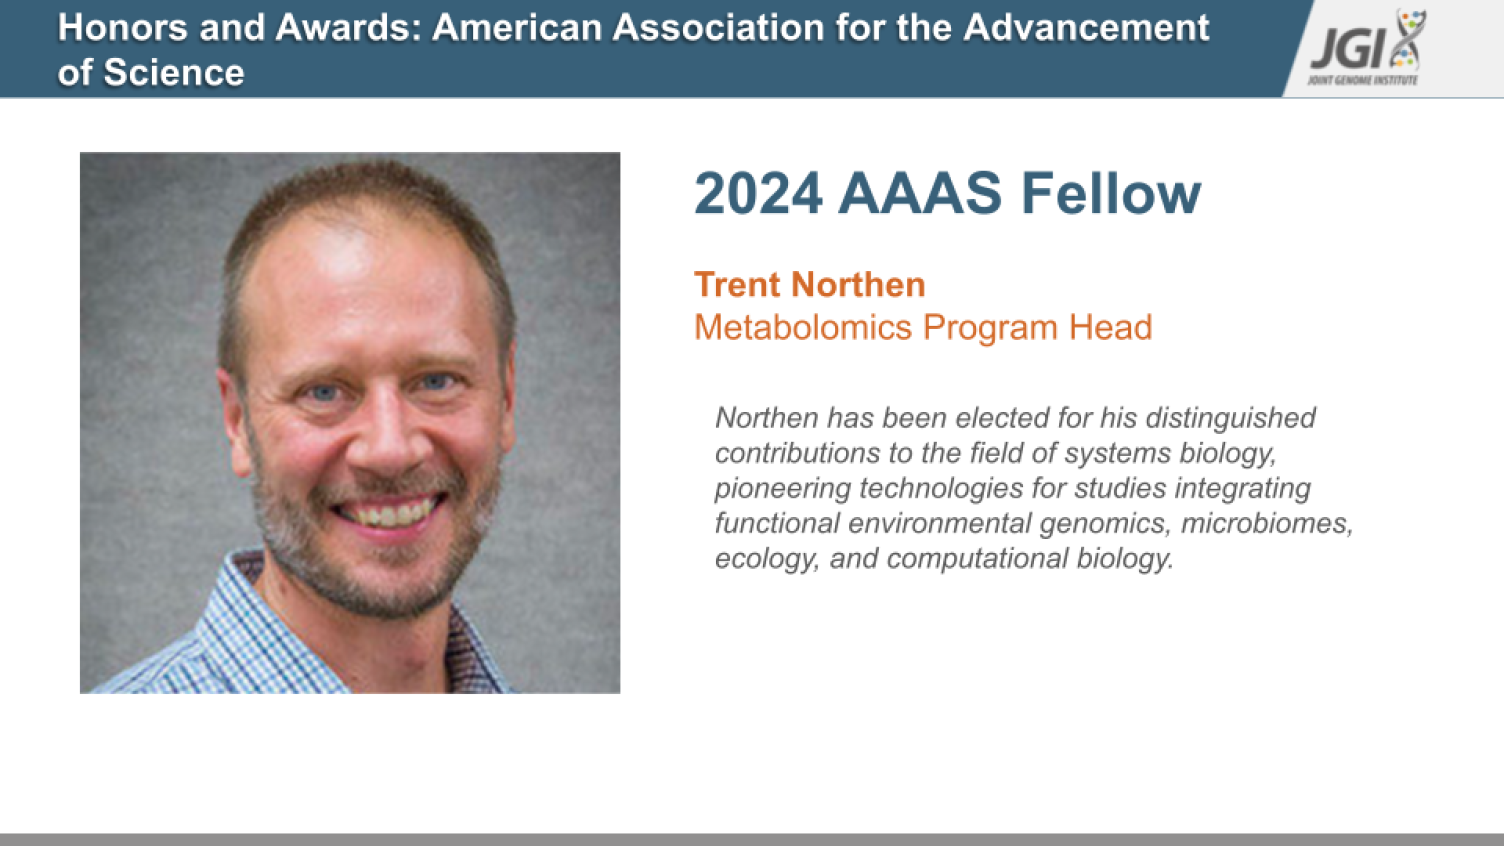
Honors & Awards
- Image

- Image
- Image

- Image

Accomplishments at a Glance
Below are briefs on some of the scientific collaborations that came out of the JGI in 2024, as well as highlights around our outreach efforts.


Impact: By the Numbers
Spending Profile

Users on the Global Map
| Region | Count | Region | Count | Region | Count |
|---|---|---|---|---|---|
| North America | 1,682 | Asia | 95 | Europe | 594 |
| United States | 1,581 | China | 21 | Austria | 12 |
| Canada | 99 | India | 8 | Belgium | 21 |
| Mexico | 8 | Israel | 17 | Croatia | 1 |
| Puerto Rico | 2 | Japan | 30 | Czech Republic | 13 |
| Malaysia | 1 | Denmark | 20 | ||
| Australia + New Zealand | 74 | Singapore | 5 | Estonia | 2 |
| Australia | 56 | South Korea | 10 | Finland | 21 |
| New Zealand | 18 | France | 71 | ||
| South America | 46 | Germany | 90 | ||
| Africa | 17 | Argentina | 1 | Greece | 10 |
| South Africa | 15 | Brazil | 34 | Hungary | 11 |
| Morocco | 1 | Chile | 3 | Ireland | 3 |
| Namibia | 1 | Colombia | 2 | Italy | 27 |
| Tunisia | 1 | Ecuador | 1 | Netherlands | 38 |
| Peru | 1 | Norway | 20 | ||
| Uruguay | 5 | Poland | 3 | ||
| Portugal | 7 | ||||
| Russian Federation | 3 | ||||
| Serbia | 2 | ||||
| Slovenia | 2 | ||||
| Spain | 37 | ||||
| Sweden | 28 | ||||
| Switzerland | 14 | ||||
| Turkey | 1 | ||||
| United Kingdom | 76 |
Users on the U.S. Map
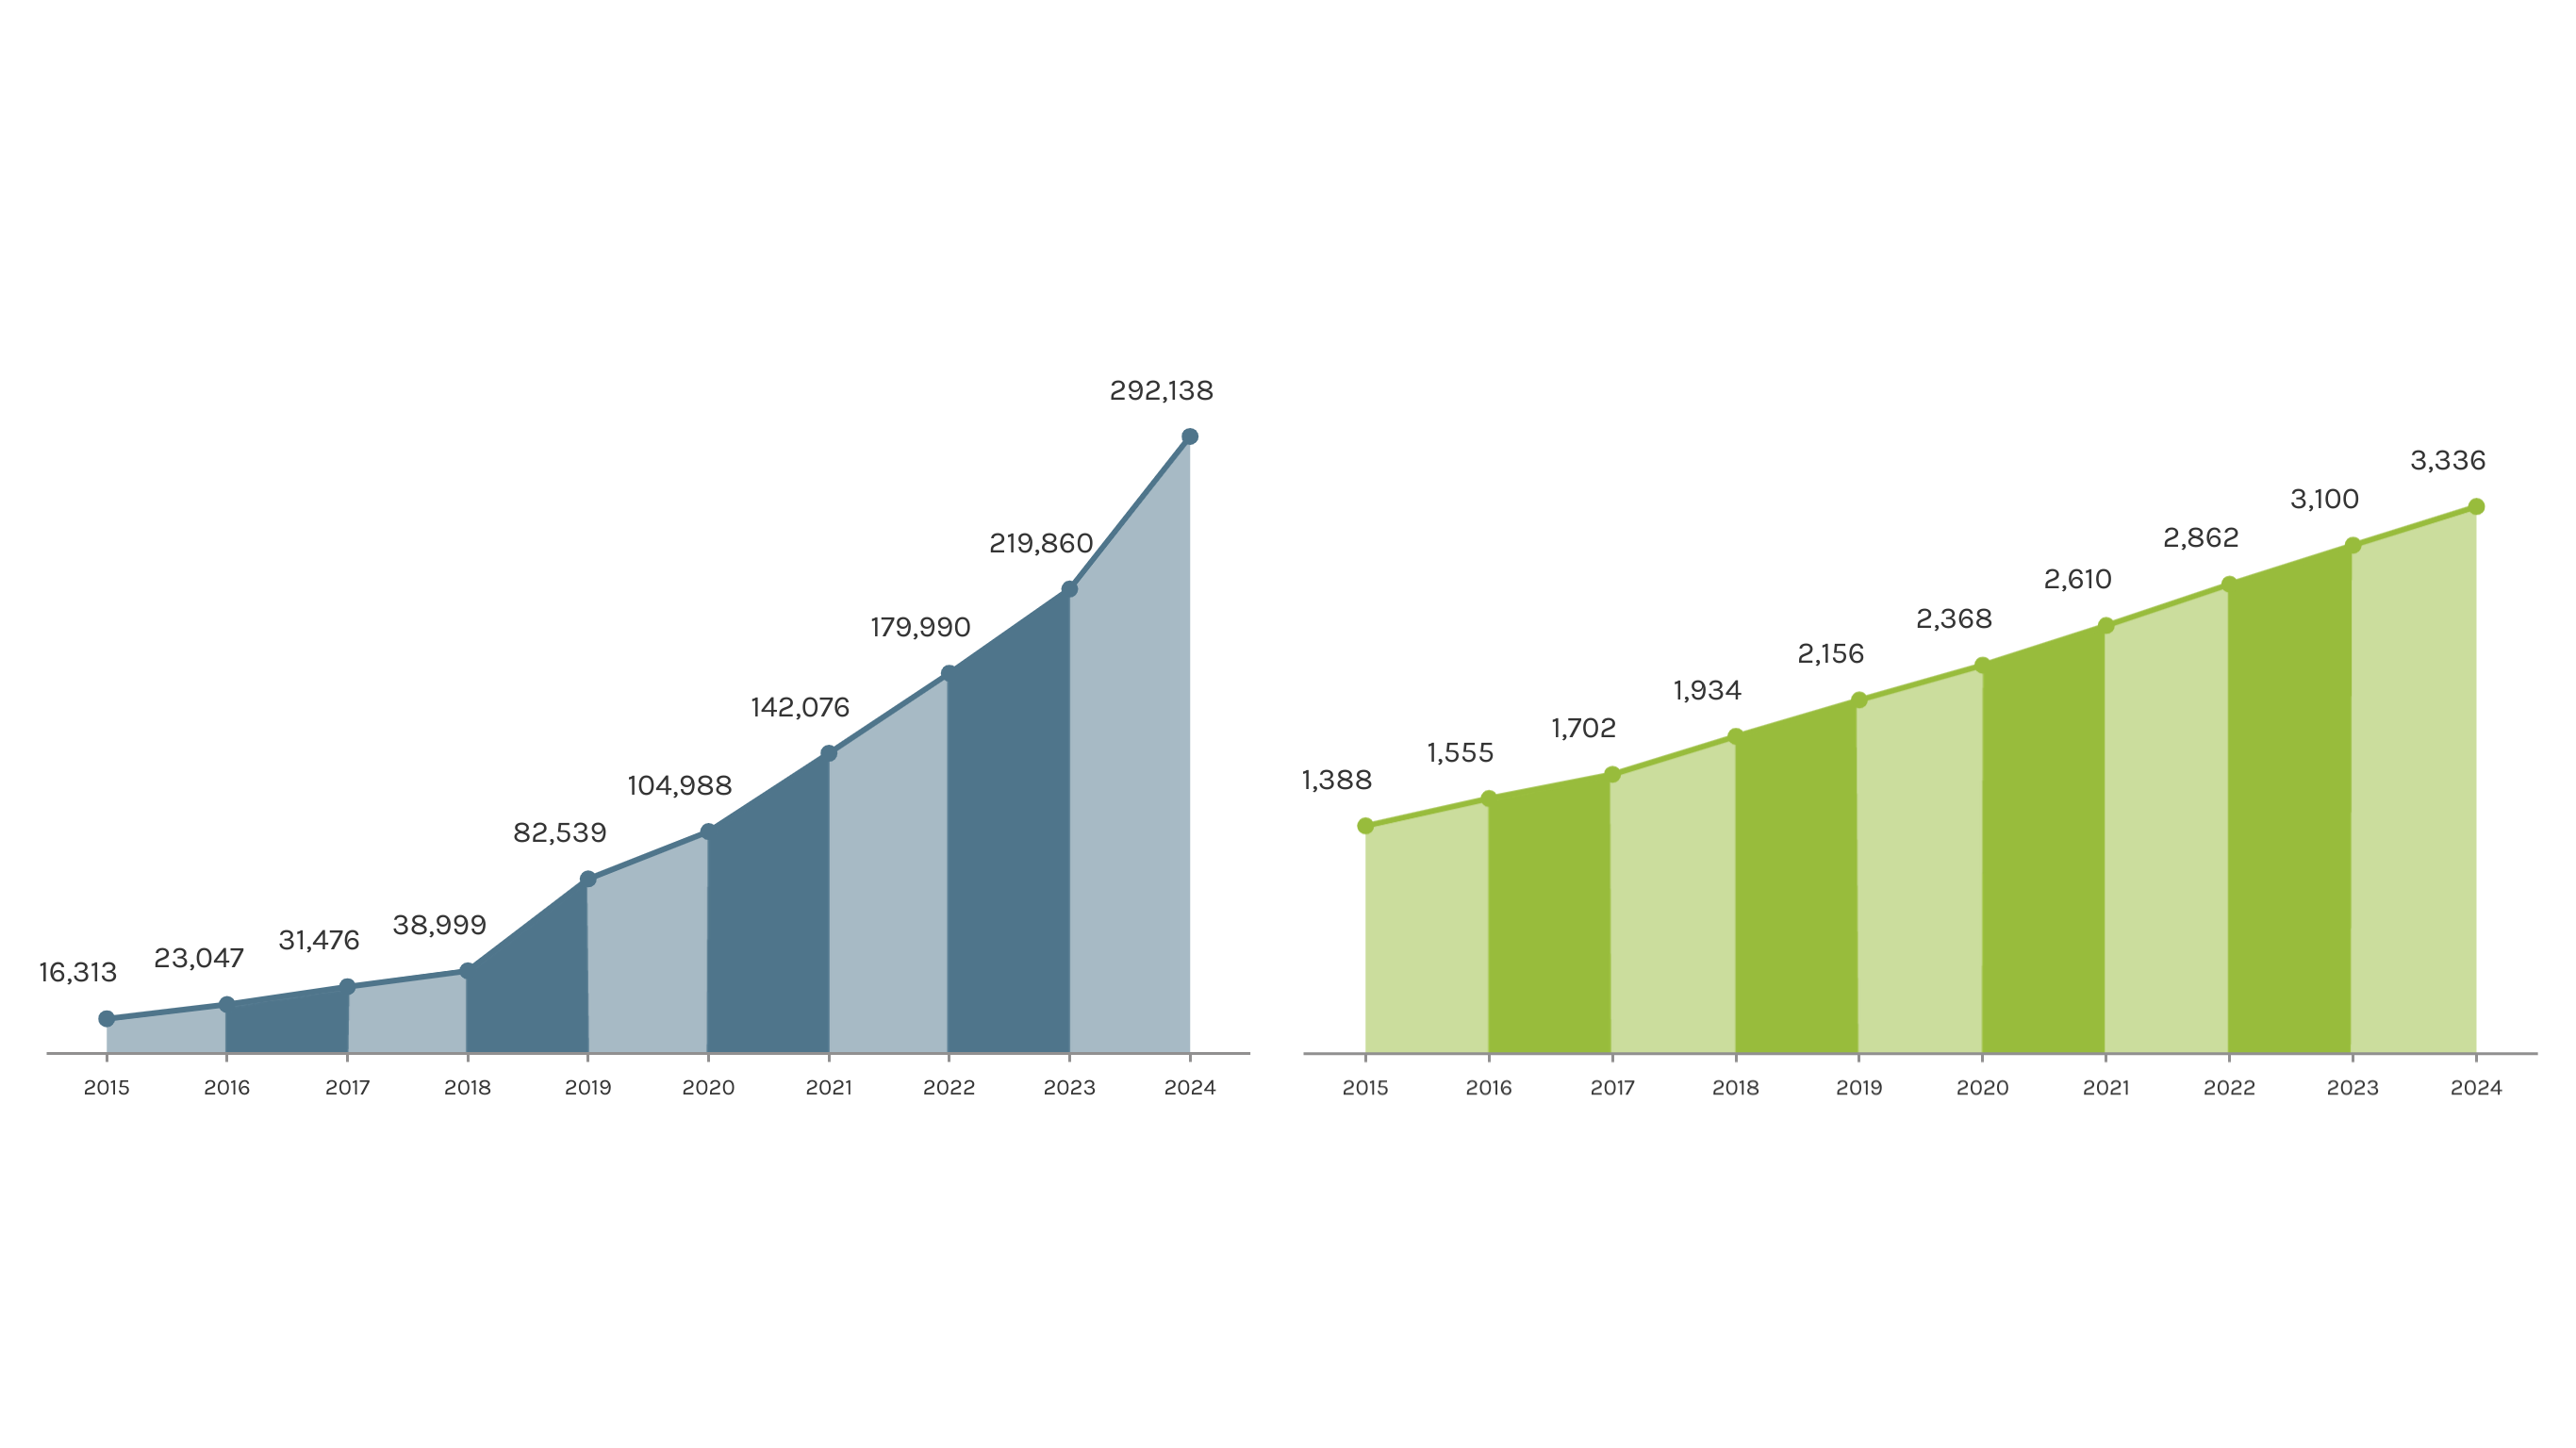
Cumulative Number of Projects Completed
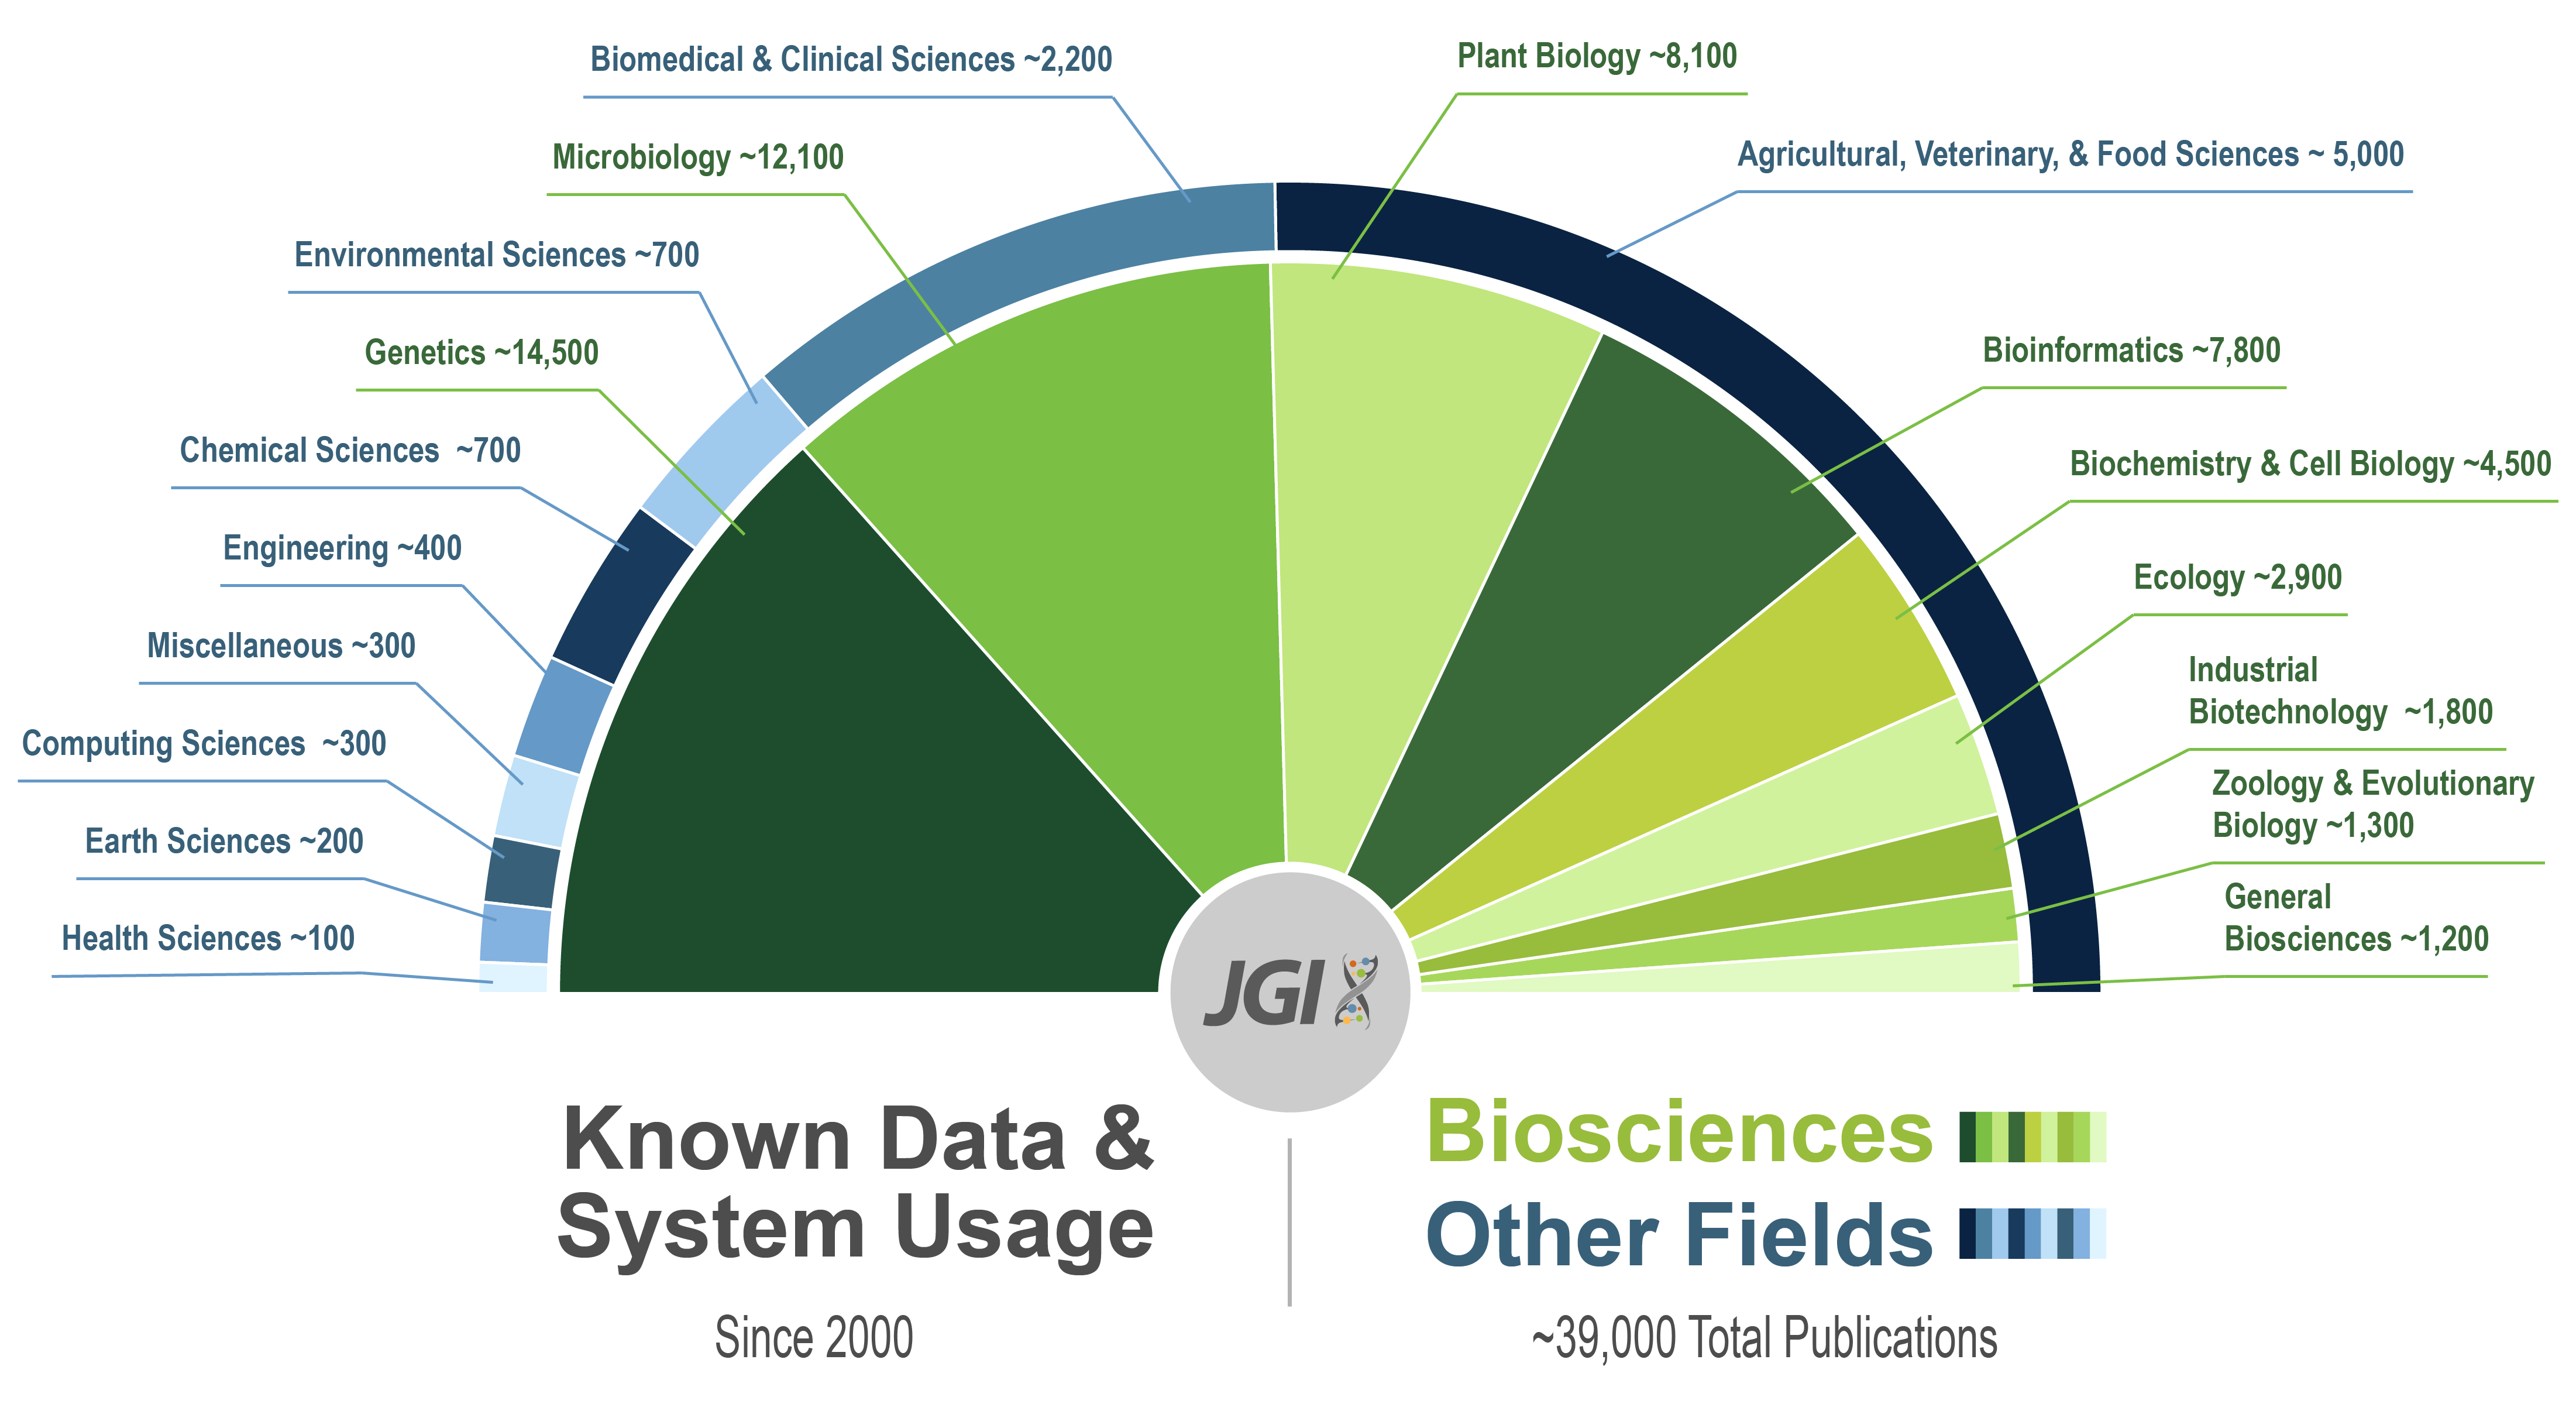
Cumulative Number of Scientific Publications
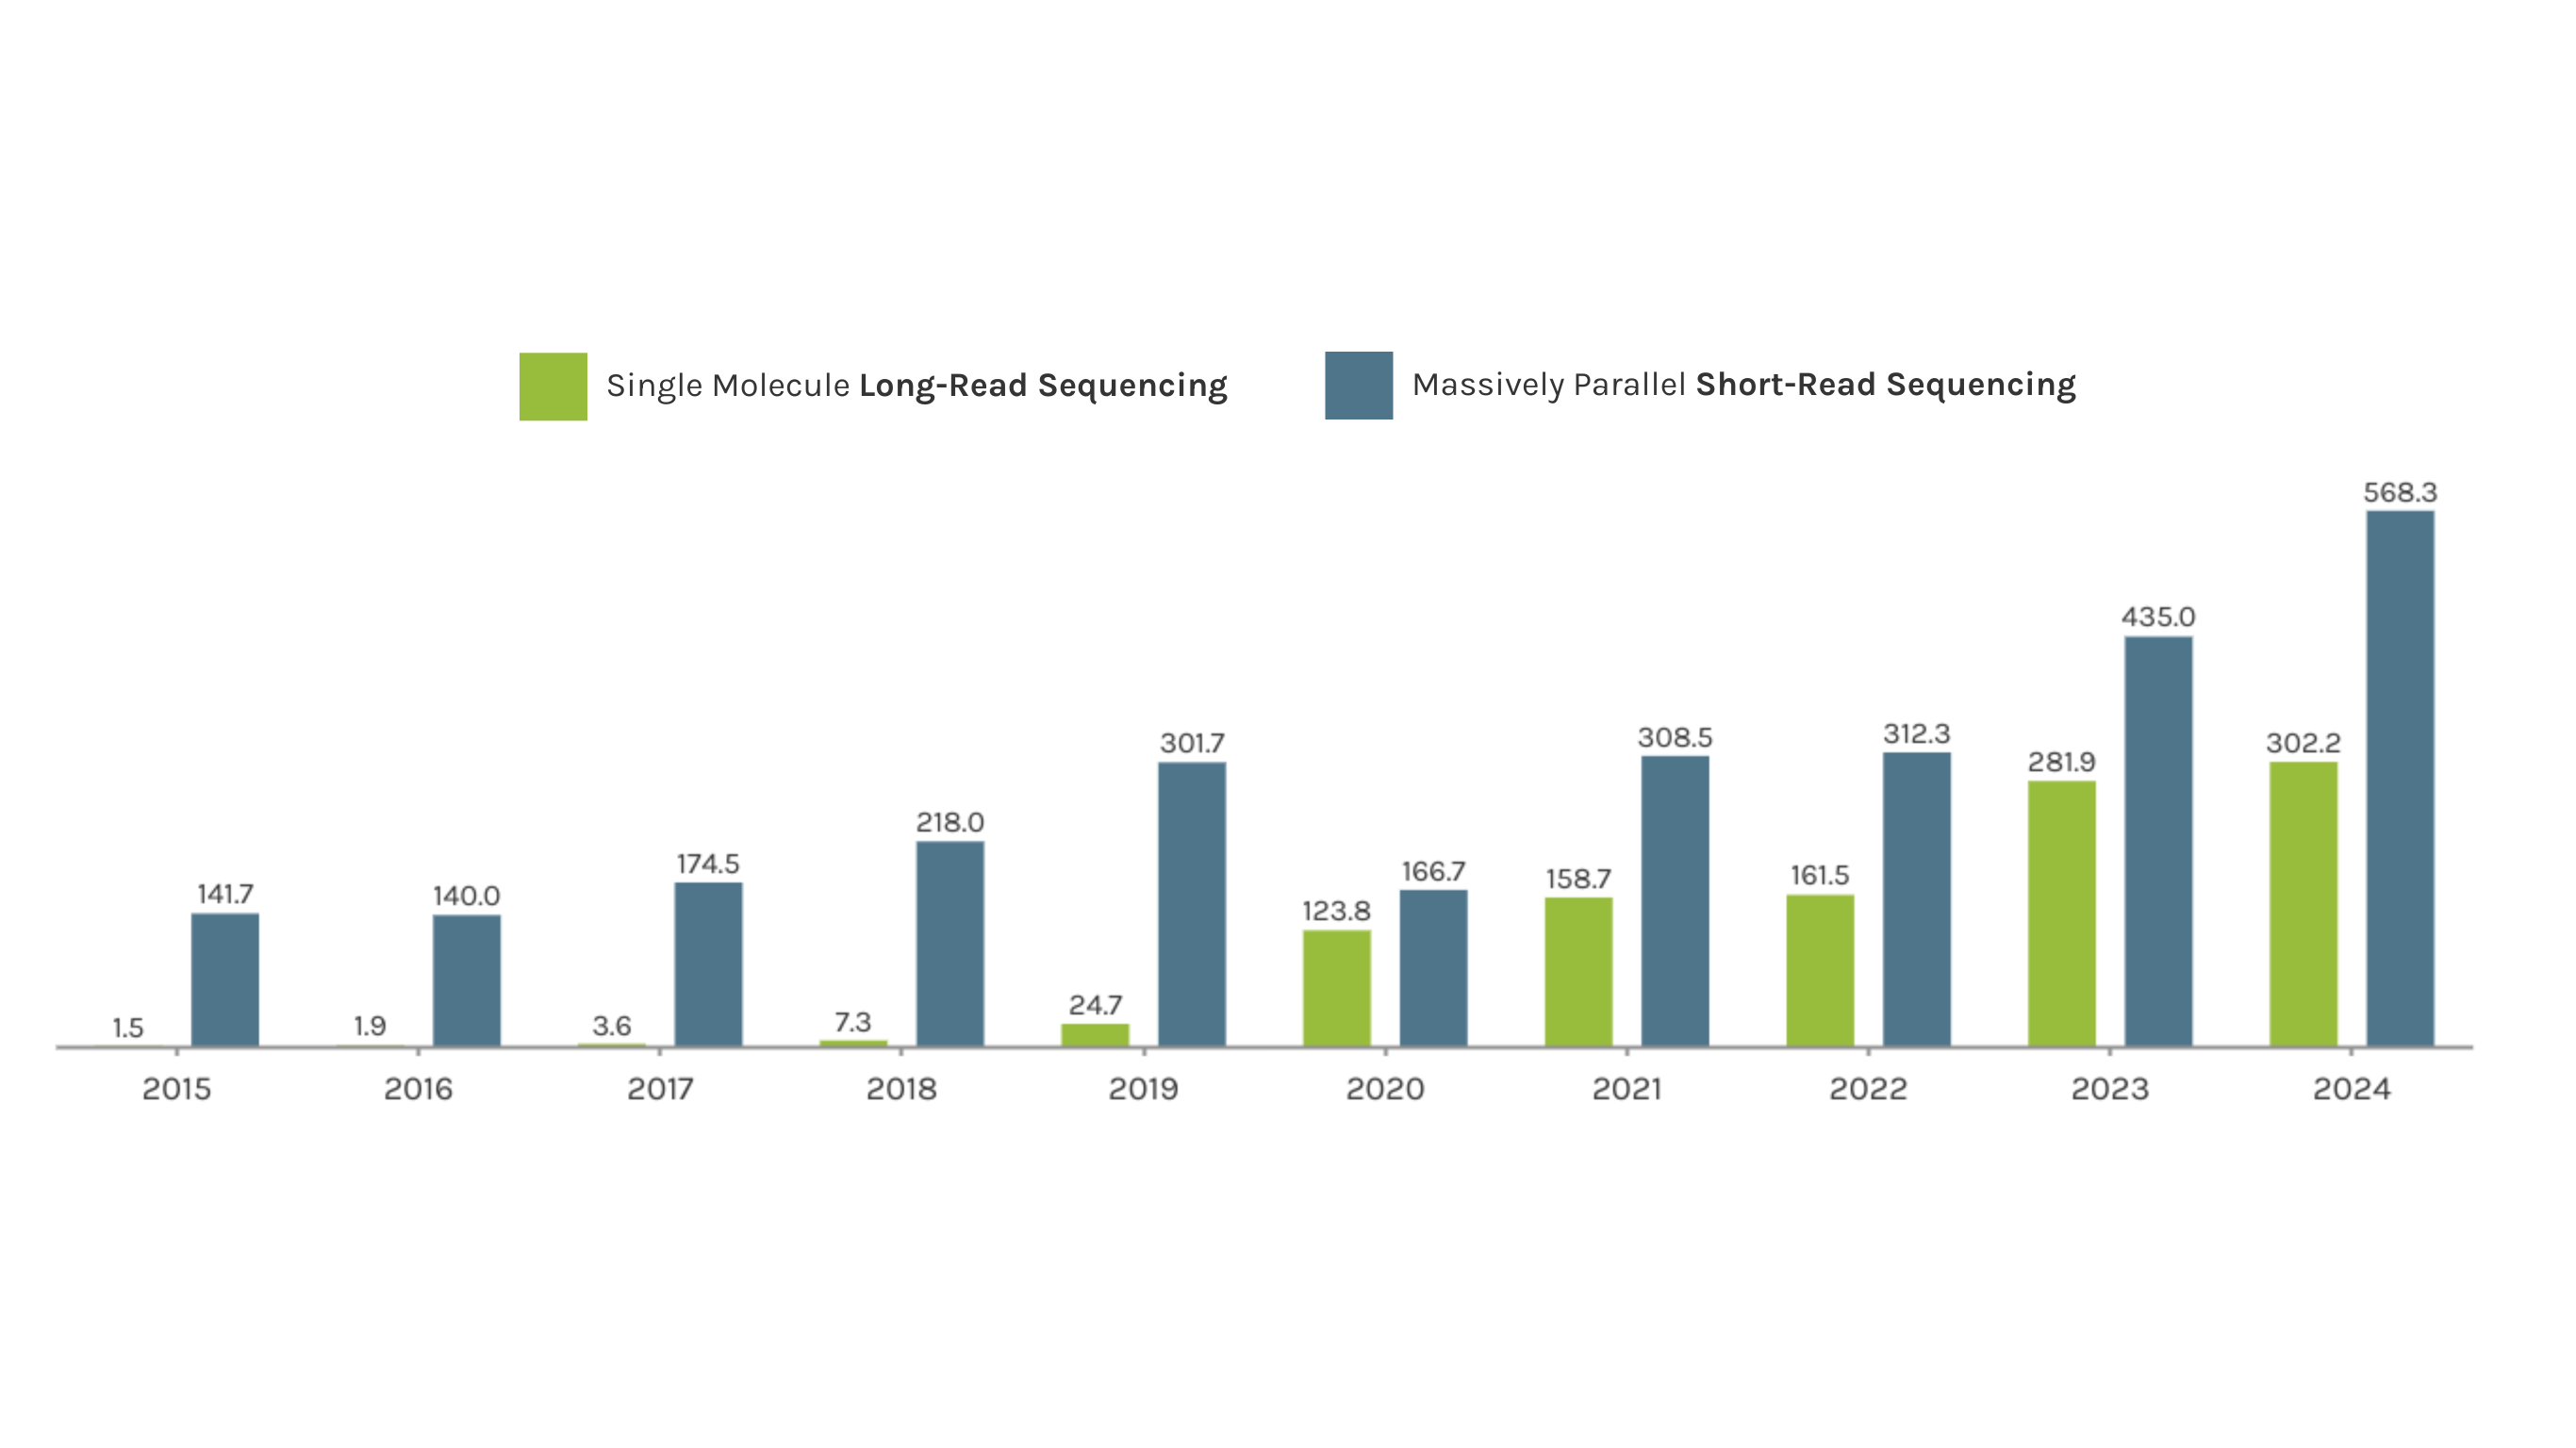
Sequencing Output
(in trillions of bases or Tb)
The JGI supports short- and long-read sequencers, where a read refers to a sequence of DNA bases. Short-read sequencers produce billions of paired-end 150 basepair reads used for genomic minimal draft assembly and resequencing projects, as well as for RNAseq annotation and quantification, such as in gene expression analysis. Long-read sequencers currently average 60,000–70,000 bp reads and are used for high-quality de novo genome assembly and full-length RNAseq transcript sequencing. Combined short-read and long-read totals per year give JGI’s annual sequence output. The total sequence output in 2024 was 870.574 Tb.
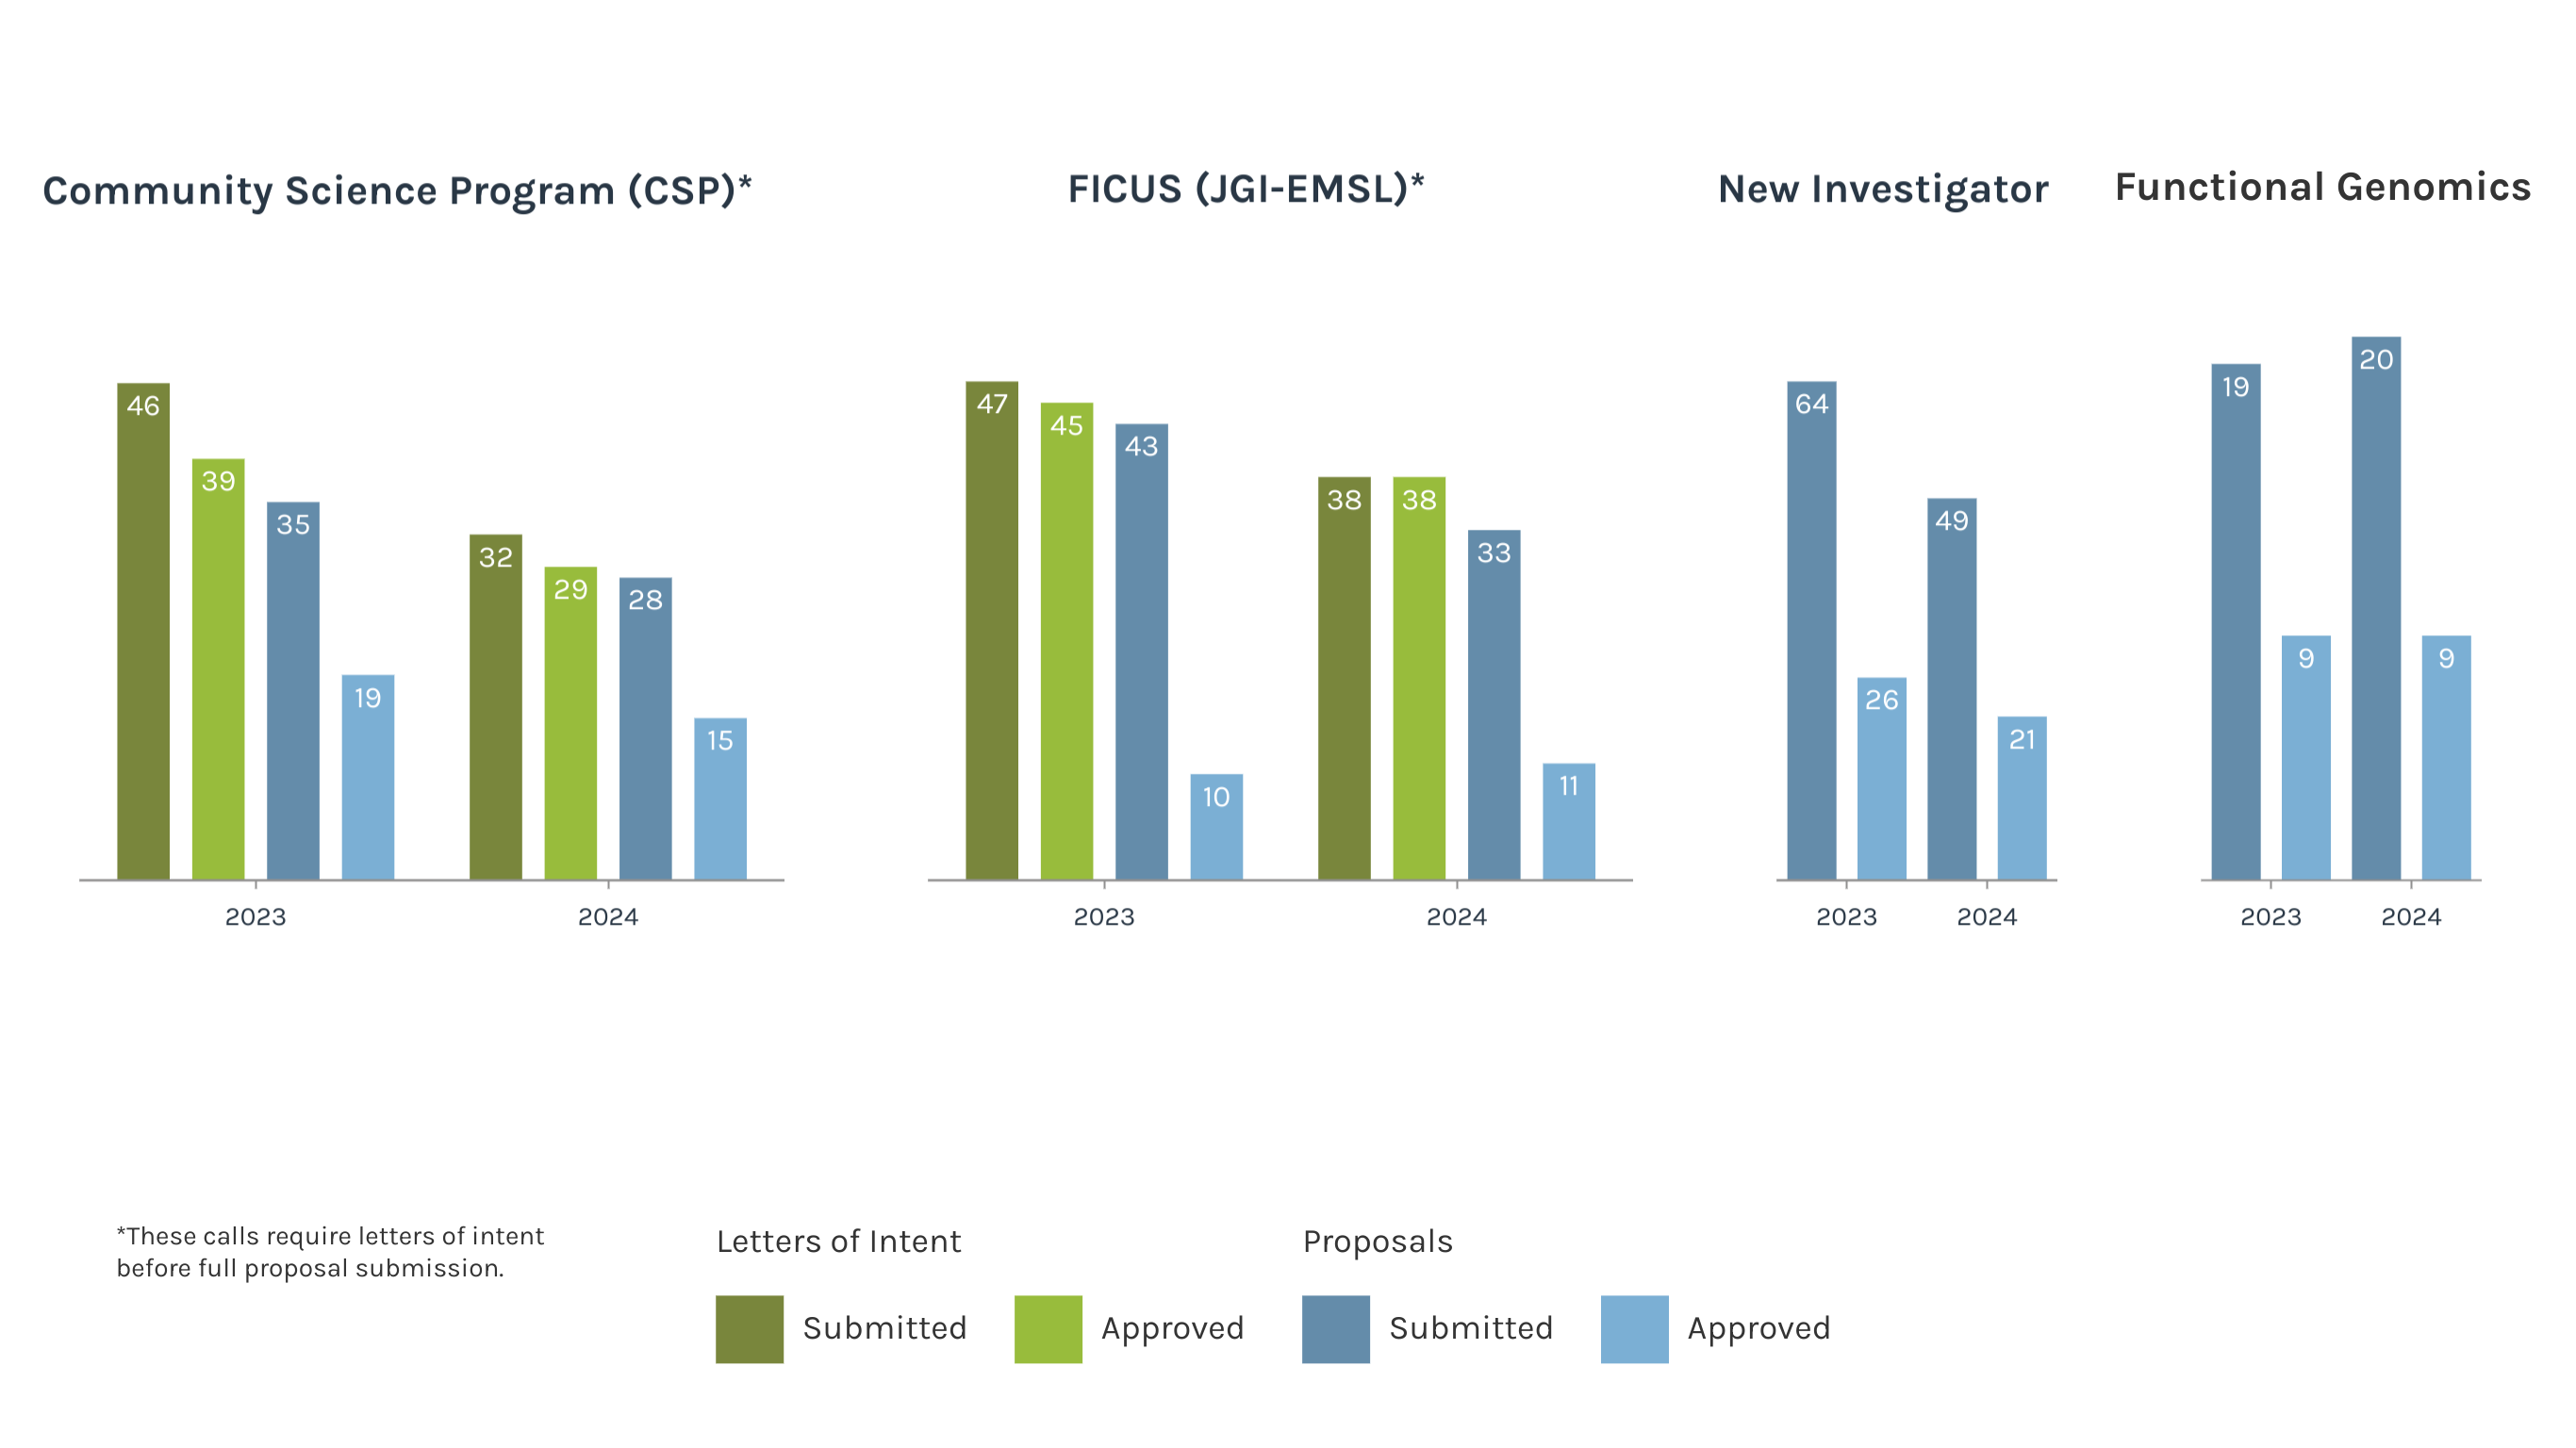
Users Letters of Intent/Proposals Submitted & Approved
Computational Infrastructure: Users of JGI Tools & Data
- JGI Archive and Metadata Organizer (JAMO): 15.192 million file records
- JAMO Archived Data Footprint: 15.952 Petabytes (PB)
- Data Downloads in FY23
- Genome Portal: 7.286 million file-downloads
- Data Portal: 0.633 million file-downloads
- Total: 7.919 million file-downloads
- Data Downloads in FY24
- Genome Portal: 6.984 million file-downloads
- Data Portal: 0.517 million file-downloads
- Total: 7.501 million file-downloads
The Genome Portal provides unified access to all JGI genomic databases and analytical tools. Users can search, download and explore data sets available for all JGI sequencing projects including their status, assemblies, and annotations of sequenced genomes. The Data Portal allows JGI users to more easily access public data sets through a common set of metadata across files submitted by each scientific program. The Genome Portal will be retired once the Data Portal reaches data- and feature-parity with its predecessor. FY2023 improvements to the Data Portal include improved data parity, cart download, navigation by pagination, and significant progress on privileged access and access management.
Since the retirement of NERSC's Cori system, a number of JGI's pipelines and processes have moved out of NERSC to the JGI's new informatics cluster, Dori, situated at LBNL's LabIT, and the computing infrastructure at IGB. This has required JGI's data management system, JAMO (JGI Archive and Metadata Organizer), to expand operations across data centers — both ingesting new data and delivering data stored at NERSC for processes running at these other centers. This has been our first step in creating a distributed version of JAMO, which in the future will be capable of sharing data across registered lab members.
As part of our business continuity planning, JGI has worked with the Environmental Molecular Sciences Laboratory to enable JAMO to automatically transmit and store files on EMSL's HPSS tape system via Globus. Currently, all new raw sequencing data is being transmitted. Over the next year, all legacy data will be restored from NERSC's tape system and transmitted automatically to EMSL.
Computational graphic by Neil Byers, JGI. Photography by Thor Swift, Berkeley Lab.